这个软件在TCGA计划里面被频繁使用者,用这个软件的目的很简单,就是你研究了很多癌症样本,通过芯片得到了每个样本的拷贝数变化信息,芯片结果一般是segment结果,可以解释为CNV区域,需要用GISTIC把样本综合起来分析,寻找somatic的CNV,并且注释基因信息。
有两个难点,一是在linux下面安装matlab工作环境,二是如何制作输入文件。
这个软件在TCGA计划里面被频繁使用者,用这个软件的目的很简单,就是你研究了很多癌症样本,通过芯片得到了每个样本的拷贝数变化信息,芯片结果一般是segment结果,可以解释为CNV区域,需要用GISTIC把样本综合起来分析,寻找somatic的CNV,并且注释基因信息。
有两个难点,一是在linux下面安装matlab工作环境,二是如何制作输入文件。
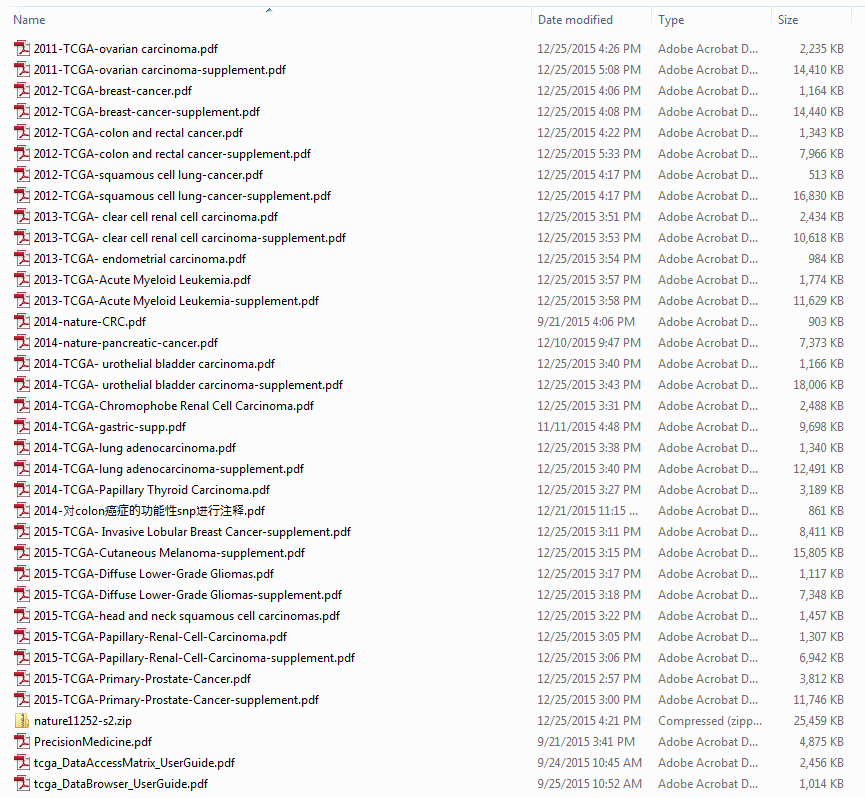
如果你研究癌症,那么TCGA计划的如此丰富的公共数据你肯定不能错过,一般人只能获取到level3的数据,当然,其实一般人也没办法使用level1和level2的数据,毕竟近万个癌症样本的原始测序数据,还是很恐怖的,而且我们拿到原始数据,再重新跑pipeline,其实并不一定比人家TCGA本身分析的要好,所以我们直接拿到分析结果,就足够啦!
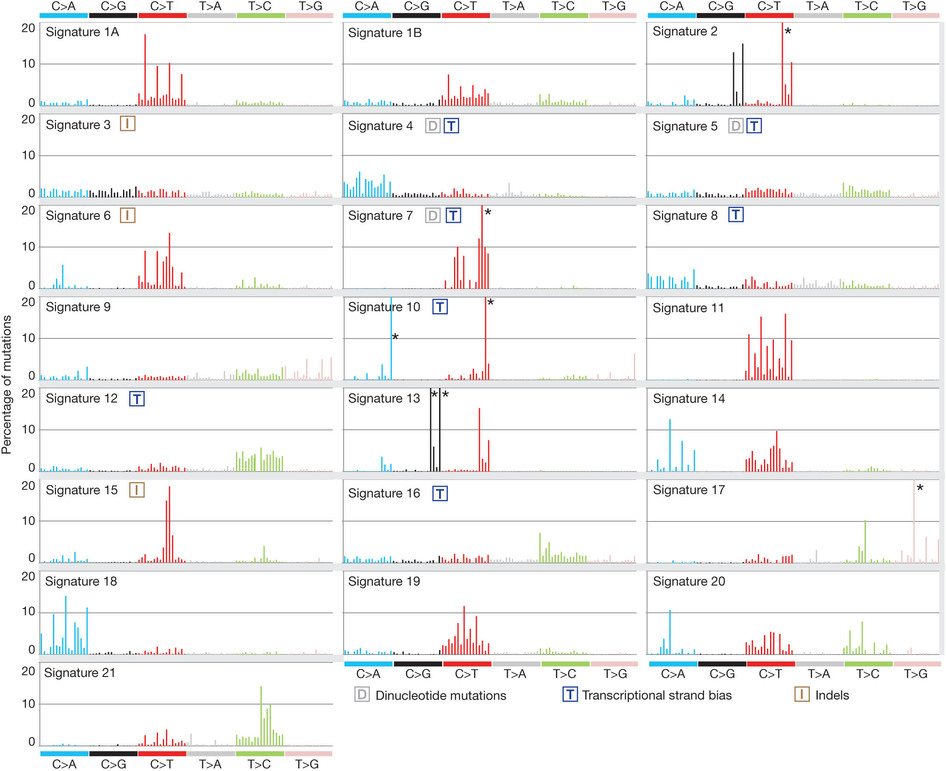
这也是对TCGA数据的深度挖掘,从而提出的一个统计学概念。文章研究了30种癌症,发现21种不同的mutation signature。如果理解了,就会发现这个其实蛮简单的,他们并不重新测序,只是拿已经有了的TCGA数据进行分析,而且居然是发表在nature上面!
研究了4,938,362 mutations from 7,042 cancers样本,突变频谱的概念只是针对于somatic 的mutation。一般是对癌症病人的肿瘤组织和癌旁组织配对测序,过滤得到的somatic mutation,一般一个样本也就几百个somatic 的mutation。
paper链接是:http://www.nature.com/nature/journal/v500/n7463/full/nature12477.html
在推特上面看到某人推荐了一篇好文,好像是某位大佬在science上面写的,大概就是鼓吹大家进入癌症研究领域。
http://science.sciencemag.org/content/352/6282/123.full
感觉写的还不错,就翻译了一下,译文如下:
| Hugo_Symbol | HUGO symbol for the gene | TP53 |
| Protein_Change | Amino acid change | V600E |
Pfam provides an online tool to not only generate the domain information in JSON format, but to draw the lollipop diagram using javascript as well. They have more information here: http://pfam.xfam.org/help#tabview=tab9
IMHO, not as pretty as cBioPortal's but it gets you close to a solution.
EDIT / SHAMELESS PLUG: After seeing the data available and how easy it'd be, I made my own quick tool to fetch the data and draw the diagram for me in a style similar to cBioPortal - feel free to fork it and add features: https://github.com/pbnjay/lollipops
Example output (w/ labels per the comments)
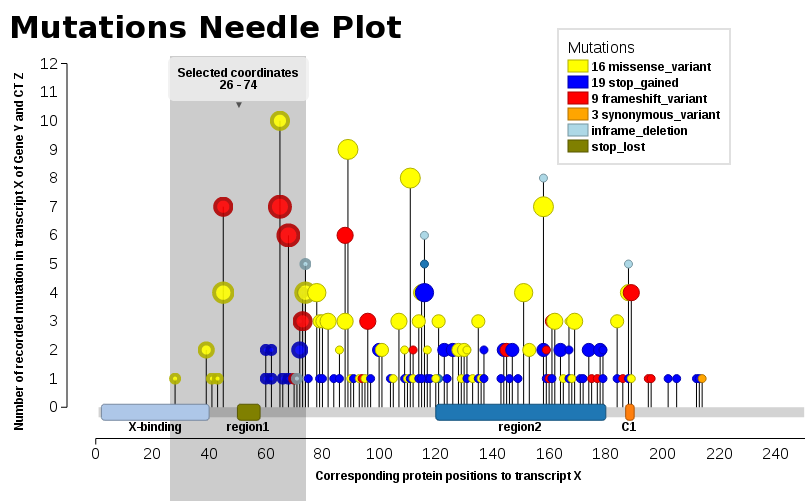
We found ourselves in the same need, we wanted such a plot (JavaScript). Thus, I add our solution, Mutations Needle Plot. The library creates an SVG image (with D3), which then may be downloaded.
You will npm in order to be able to install & run the library.
Examples may be found in the snippets folder or also the index.html - The one displayed here below
用my.surv <- surv(OS_MONTHS,OS_STATUS=='DECEASED')构建生存曲线。用kmfit2 <- survfit(my.surv~TUMOR_STAGE_2009)来做某一个因子的KM生存曲线。用 survdiff(my.surv~type, data=dat)来看看这个因子的不同水平是否有显著差异,其中默认用是的logrank test 方法。用coxph(Surv(time, status) ~ ph.ecog + tt(age), data=lung) 来检测自己感兴趣的因子是否受其它因子(age,gender等等)的影响。
step4:Unsupervised hierarchical clustering (1-Spearman distance, average linkage) was performed on the cell lines using the aCGH data.
Putative driver genes of which copy number aberrations correlated to mRNA gene expression were identified to determine subtypes or clusters that are driven by different mechanisms. This was done using Mann Whitney U-test with p<0.05, and Spearman Correlation Coefficient test with Rho >0.6.
step5:We then performed consensus clustering[17] on the gene expression data of the 27 gastric cancer cell lines from CCLE using these putative driver genes. We selected k = 2 as it gives sufficiently stable similarity matrix.
step6: In order to assign new samples to this integrative cluster, significance analysis of microarray (SAM) [18]with threshold q<2.0 was used to generate subtype signature based on the mRNA expression data of the 1762 genes from the 27 gastric cancer cell lines in CCLE.
先用甲基化数据来聚类,得到putative driver genes,然后再用这些基因的表达数据来再次聚类,分成两类,然后对这两类进行SAM找差异基因
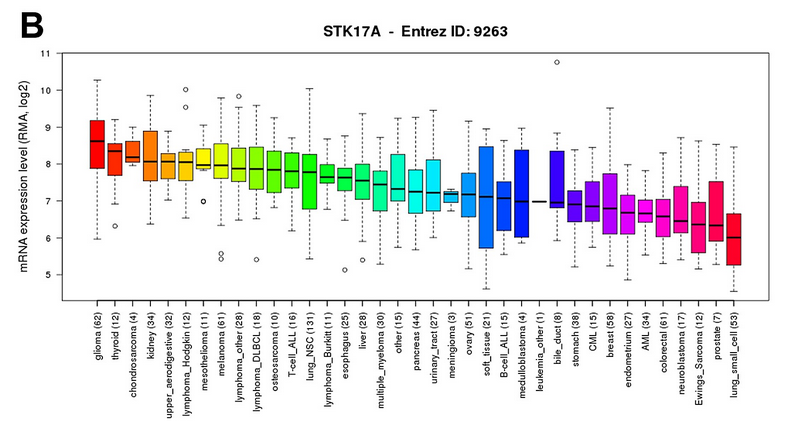
结论就是:STK17A is highly expressed in glioma cell lines compared to other cancer types. Data was obtained through the Cancer Cell Line Encyclopedia (CCLE).
第三篇文献:http://www.nature.com/ncomms/2013/130709/ncomms3126/fig_tab/ncomms3126_F4.html
来自于:https://www.biostars.org/p/19104/
Here are a few more, a summary of the other answers, and updated links:
For a much more general discussion of variant calling (not necessarily somatic or limited to SNVs/InDels) check out this thread: What Methods Do You Use For In/Del/Snp Calling?
Some papers describing comparisons of these callers:
The ICGC-TCGA DREAM Mutation Calling challenge has a component on somatic SNV calling.
This paper used validation data to compare popular somatic SNV callers:
Detecting somatic point mutations in cancer genome sequencing data: a comparison of mutation callers
You'll need to update the link to MuTect. Broad Institute has begun to put portable versions of their tools on Github, like thelatest release of MuTect. The Genome Institute at WashU has been using Github for a while, but portable versions of their tools can be found here and here.
To rehash/expand on what Dan said, if you're sequencing normal tissue, you generally expect to see single-nucleotide variant sites fall into one of three bins: 0%, 50%, or 100%, depending on whether they're heterozygous or homozygous.
With tumors, you have to deal with a whole host of other factors:
These, and other factors, make calling somatic variants difficult and still an area that is being heavily researched. If someone tells you that somatic variant calling is a solved problem, they probably have never tried to call somatic variants.
Sounds like somatic / tumor variant calling is something that will be solved by improvements at the wet lab side ( single cell selection / amplification / sequencing ) . Rather than at the computational side.
Well, single cell has a role to play (and would have more of one if WGA wasn't so lossy), but realistically, you can't sequence billions of cells from a tumor individually. Bulk sequencing still is going to have a role for quite a while.
Hell germ line calling isn't even a solved problem. Still get lots of false positives (and false negatives). It just tends to work so well that it is hard to improve it much except by making it faster, less memory intensive, etc
Solved was the wrong word. I just meant improved. There is only so much you can do at the computational side. Wet lab also has its part to play.
A germline variant caller generally has a ploidy-based genotyping algorithm built in to part of the algorithm/pipeline. I believe, IIRC, the GATK UnifiedGenotyper for instance does both variant calling and then genotype calling. So to call a genotype for a variant it is expecting a certain number of reads to support the alternative allele. When working with somatic variants all of the assumptions about how many reads you expect with a variant at a position to distinguish between true and false positives are no longer valid. Except for fixed mutations throughout the tumor population only some proportion of cells will hold a somatic variation. You also typically have some contamination from normal non-cancerous cells. Add in complications from significant genomic instability with lots of copy number variations and such and you have a need for a major change in your model for calling variation while minimizing artifactual calls. So you have a host of other programs that have been developed specifically for looking at somatic variation in tumor samples.
一篇文献:
是qiagen公司发的
High-throughput sequencing is rapidly becoming common practice in clinical diagnosis and cancer research. Many algorithms have been developed for somatic single nucleotide variant (SNV) detection in matched tumor-normal DNA sequencing. Although numerous studies have compared the performance of various algorithms on exome data, there has not yet been a systematic evaluation using PCR-enriched amplicon data with a range of variant allele fractions. The recently developed gold standard variant set for the reference individual NA12878 by the NIST-led “Genome in a Bottle” Consortium (NIST-GIAB) provides a good resource to evaluate admixtures with various SNV fractions.
Using the NIST-GIAB gold standard, we compared the performance of five popular somatic SNV calling algorithms (GATK UnifiedGenotyper followed by simple subtraction, MuTect, Strelka, SomaticSniper and VarScan2) for matched tumor-normal amplicon and exome sequencing data.
Nevertheless, detecting somatic mutations is still challenging, especially for low-allelic-fraction variants caused by tumor heterogeneity, copy number alteration, and sample degradation
We used QIAGEN’s GeneRead DNAseq Comprehensive Cancer Gene Panel (CCP, Version 1) for enrichment and library construction in triplicate。
QIAGEN’s GeneRead DNAseq Comprehensive Cancer Gene Panel (Version 1) was used to amplify the target region of interest (124 genes, 800 Kb).
When analyzing different types of data, use of different algorithms may be appropriate.
DNA samples of NA12878 and NA19129 were purchased from Coriell Institute. Sample mixtures were created based on the actual amplifiable DNA in each sample, resulting in 0%, 8%, 16%, 36%, and 100% of NA12878 sample mixed in the NA19129 sample, respectively.We treated the mixed samples at 8%, 16%, 36%, and 100% as the virtual tumor samples and the 0% as the virtual normal sample.
五个软件的算法是:
1. NaiveSubtract — SNVs were called separately from virtual tumor and normal samples using GATK UnifiedGenotyper [22]. For exome sequencing data, reads were already mapped, locally realigned and recalibrated by the 1,000 Genomes Project. So SNVs were directly called on the BAM files using GATK Unified Genotyper. Then, SNVs detected in the virtual normal sample were removed from the list of SNVs detected in the virtual tumor sample, leaving the “somatic” SNVs.
2. MuTect — MuTect is a method developed for detecting the most likely somatic point mutations in NGS data using a Bayesian classifier approach. The method includes pre-processing aligned reads separately in tumor and normal samples and post-processing resulting variants by applying an additional set of filters. We ran MuTect under the High-Confidence mode with its default parameter settings. We disabled the “Clustered position” filter and the “dbSNP filter” for the amplicon sequencing reads, and we disabled the “dbSNP filter” for the exome sequencing.
3. SomaticSniper — SomaticSniper calculates the Bayesian posterior probability of each possible joint genotype across the normal and cancer samples. We tuned the software’s parameters to increase sensitivity and then filtered raw results using a Somatic Score cut-off of 20 to improve specificity.
4. Strelka — Strelka reports the most likely genotype for tumor and normal samples based on a Bayesian probability model. Post-calling filters built into the software are based on factors such as read depth, mismatches, and overlap with indels. We skipped depth filtration for exome and amplicon sequencing data as recommended by the Strelka authors. For the amplicon sequencing reads, we set the minimum MAPQ score at 17 for consistency with the defaults in GATK UnifiedGenotyper. We used variants passing Strelka post-calling filters for analysis.
5. VarScan2 — VarScan2 performs analyses independently on pileup files from the tumor and normal samples to heuristically call a genotype at positions achieving certain thresholds of coverage and quality. Then, sites of the genotypes not matched in tumor and normal samples are classified into somatic, germline, or ambiguous groups using Fisher’s exact test. We generated the pileup files using SAMtools mpileup command.
The compatibility of the output VCF files between different methods as well as the NIST-GIAB gold standard was examined using bcbio.variation tools and manual inspection. The reported SNP call representations between files are comparable to each other.
做过癌症数据分析的童鞋都知道,TCGA里面用maf格式来记录突变!那么maf格式的数据是如何得来的呢,我们都知道,做完snp-calling一般是得到vcf格式的突变记录数据文件,然后再用annovar或者其它蛋白结构功能影响预测软件注释一下,还远达不到maf的近100条记录。
ACC  BLCA  BRCA  CESC  COAD  COADREAD  DLBC  ESCA
	GBM  HNSC  KICH  KIRC  KIRP  LAML  LGG  LIHC
	LUAD  LUSC  OV  PAAD  PANCANCER  PANCAN8  PANCAN12  PRAD
	READ  SARC  SKCM  STAD  THCA  UCEC  UCS
都是发表在nature,cell还有新英格兰医学杂志上面的超级文章!每个文章附件都有一百多页,比博士论文还长,但是它们的分析套路其实都一样,都是那几种数据,包括WGS,WES,RNA-Seq,芯片表达量,miRNA表达量,甲基化数据,蛋白数据。分析过程也差不多,无法就是对癌症进行进一步的分类,癌症亚型,或者看看driver mutation,进一步解释癌症病变,转移,扩散机理,或者找标记物signature,辅助治疗等等,具体的要等我把这些文献看完了才能再进一步讲解,请做癌症研究方向的一定要把它们看完。
我已经下载完了,大家如果没有权限下载,就需要自己想办法啦!
非常值得大家阅读!!!
从数以万计的突变里面找到driver mutation这个课题很大,里面的软件我接触的就有十几个了,但是我尝试了其中几个,总是无法运行成功,不知道为什么,终于今天成功了一个,就是mutsig软件! 其实关于突变数据找driver mutation ,台湾一个大学做了一个数据库DriverDB http://ngs.ym.edu.tw/driverdb/: 还因此发了一篇文章:http://nar.oxfordjournals.org/content/early/2013/11/07/nar.gkt1025.full.pdf,挺不错的!
关于driver mutation的理论最近也进化了很多,算是比较完善了吧,但是我一直没时间静下心来好好补充理论知识,很多软件,都只是用过,很多数据,也只是处理了一下,不知道为什么要去做,╮(╯▽╰)╭扯远了,开始谈这个软件吧!
mutsig软件是broadinstitute出品的,所以可靠性非常好咯,来源于一篇nature文章:http://www.nature.com/nature/journal/v505/n7484/full/nature12912.html,而该软件的地址是:http://www.broadinstitute.org/cancer/cga/mutsig_run 需要简单注册才能下载的。
该nature文章是这样描述这个软件的优点的:We used the most recent version of the MutSig suite of tools, which looks for three independent signals: highmutational burden relative to background expectation, accounting for heterogeneity; clustering of mutations within the gene; and enrichment of mutations in evolutionarily conserved sites. Wecombined the significance levels (P values) fromeach test to obtain a single significance level per gene (Methods).
这个软件需要安装matlab环境才能使用,所以我前面就写了教程,如何安装!http://www.bio-info-trainee.com/?p=1166
如果已经安装好了matlab环境,那么直接下载这个软件就可以使用了,软件解压就OK拉,而且人家还提供了测试文件!
软件下载后,解压可以看到里面的一个脚本,软件说明书写的非常简单,当然,使用这个软件也的确非常简单:
run_MutSigCV.sh <path_to_MCR> mutations.maf coverage.txt covariates.txt output.txt 即可,其中所有的数据都是可以下载的,
运行完了测试数据, 就证明你的软件安装没有问题啦!如果你只有突变数据的maf格式,maf格式可以参考:https://www.biostars.org/p/69222/ ,也可以使用该软件:如下
run_MutSigCV.sh <path_to_MCR> my_mutations.maf exome_full192.coverage.txt gene.covariates.txt my_results mutation_type_dictionary_file.txt chr_files_hg19
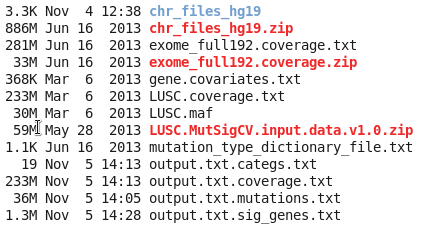
上面三个zip文件,都是可以在mutsig软件官网找到下载链接的,是必须下载的!使用很简单,就一个命令即可,但是把你的vcf突变数据做成该软件需要的maf格式,是一个难题!
| 肾上腺皮质 | Adrenocortical carcinoma | ACC | 92 | Browse | Browse |
| 膀胱,尿路上皮 | Bladder urothelial carcinoma | BLCA | 412 | Browse | Browse |
| 乳腺癌 | Breast invasive carcinoma | BRCA | 1098 | Browse | Browse |
| 子宫颈 | Cervical and endocervical cancers | CESC | 307 | Browse | Browse |
| 胆管癌 | Cholangiocarcinoma | CHOL | 36 | Browse | Browse |
| 结肠腺癌 | Colon adenocarcinoma | COAD | 460 | Browse | Browse |
| 大肠腺癌 | Colorectal adenocarcinoma | COADREAD | 631 | Browse | Browse |
| 淋巴肿瘤弥漫性大B细胞淋巴瘤 | Lymphoid Neoplasm Diffuse Large B-cell Lymphoma | DLBC | 58 | Browse | Browse |
| 食管 | Esophageal carcinoma | ESCA | 185 | Browse | Browse |
| FFPE试点二期 | FFPE Pilot Phase II | FPPP | 38 | None | Browse |
| 胶质母细胞瘤 | Glioblastoma multiforme | GBM | 613 | Browse | Browse |
| 脑胶质瘤 | Glioma | GBMLGG | 1129 | Browse | Browse |
| 头颈部鳞状细胞癌 | Head and Neck squamous cell carcinoma | HNSC | 528 | Browse | Browse |
| 肾嫌色 | Kidney Chromophobe | KICH | 113 | Browse | Browse |
| 泛肾 | Pan-kidney cohort (KICH+KIRC+KIRP) | KIPAN | 973 | Browse | Browse |
| 肾透明细胞癌 | Kidney renal clear cell carcinoma | KIRC | 537 | Browse | Browse |
| 肾乳头细胞癌 | Kidney renal papillary cell carcinoma | KIRP | 323 | Browse | Browse |
| 急性髓系白血病 | Acute Myeloid Leukemia | LAML | 200 | Browse | Browse |
| 脑低级神经胶质瘤 | Brain Lower Grade Glioma | LGG | 516 | Browse | Browse |
| 肝癌 | Liver hepatocellular carcinoma | LIHC | 377 | Browse | Browse |
| 肺腺癌 | Lung adenocarcinoma | LUAD | 585 | Browse | Browse |
| 肺鳞状细胞癌 | Lung squamous cell carcinoma | LUSC | 504 | Browse | Browse |
| 间皮瘤 | Mesothelioma | MESO | 87 | Browse | Browse |
| 卵巢浆液性囊腺癌 | Ovarian serous cystadenocarcinoma | OV | 602 | Browse | Browse |
| 胰腺癌 | Pancreatic adenocarcinoma | PAAD | 185 | Browse | Browse |
| 嗜铬细胞瘤和副神经节瘤 | Pheochromocytoma and Paraganglioma | PCPG | 179 | Browse | Browse |
| 前列腺癌 | Prostate adenocarcinoma | PRAD | 499 | Browse | Browse |
| 直肠腺癌 | Rectum adenocarcinoma | READ | 171 | Browse | Browse |
| 肉瘤 | Sarcoma | SARC | 260 | Browse | Browse |
| 皮肤皮肤黑色素瘤 | Skin Cutaneous Melanoma | SKCM | 470 | Browse | Browse |
| 胃腺癌 | Stomach adenocarcinoma | STAD | 443 | Browse | Browse |
| 胃和食管癌 | Stomach and Esophageal carcinoma | STES | 628 | Browse | Browse |
| 睾丸生殖细胞肿瘤 | Testicular Germ Cell Tumors | TGCT | 150 | Browse | Browse |
| 甲状腺癌 | Thyroid carcinoma | THCA | 503 | Browse | Browse |
| 胸腺瘤 | Thymoma | THYM | 124 | Browse | Browse |
| 子宫内膜癌 | Uterine Corpus Endometrial Carcinoma | UCEC | 560 | Browse | Browse |
| 子宫癌肉瘤 | Uterine Carcinosarcoma | UCS | 57 | Browse | Browse |
| 葡萄膜黑色素瘤 | Uveal Melanoma | UVM | 80 | Browse | Browse |
看起来癌症很多呀,任重道远
文献名:Differential Pathogenesis of Lung Adenocarcinoma Subtypes Involving Sequence Mutations, Copy Number, Chromosomal Instability, and Methylation
Lung adenocarcinoma (LAD)的遗传变异度很大。
这个癌症可以分成三类:The LAD molecular subtypes (Bronchioid, Magnoid, and Squamoid)
然后我们在三个subtypes里面分析了以下四个特征,发现不同subtypes差异非常显著。
1、Gene mutation rates (EGFR, KRAS, STK11, TP53),
2、chromosomal instability,
3、regional copy number
4、genomewide DNA methylation
另外三个临床特征也是很显著。
1、Patient overall survival,
2、cisplatin plus vinorelbine therapy response
3、predicted gefitinib sensitivity
所以,我们的分类非常好,而且对临床非常有帮助。
对LAD的研究数据包括
1,DNA copy number
2,gene sequence mutation
3,DNA methylation
4,gene expression
即使是TP53这样的基因在LAD的突变率也才35%,所以我们的LAD应该更加细分,因为EGFR mutation and KRAS mutation这样的突变对治疗很有指导意义,细分更加有助于临床针对性治疗方案的选择。
我们选取了116个LAD样本的数据,分析了1,genome-wide gene expression,,2,genomewide DNA copy number, 3,genome-wide DNA methylation, 4,selected gene sequence mutations
得到的结论是:LAD molecular subtypes correlate with grossly distinct genomic alterations and patient therapy response
数据来源如下:
Gene expression --> Agilent 44 K microarrays.
DNA copy number --> Affymetrix 250 K Sty and SNP6 microarrays.
DNA methylation --> MSNP microarray assay.
DNA from EGFR, KRAS, STK11 and TP53 exons --> ABI sequencers
我们用的是R语言包 ConsensusClusterPlus根据gene expression 来对我们的LAD进行分类molecular subtypes
分类的基因有506个(the top 25% most variable genes, 3,045, using ConsensusClusterPlus),A nearest centroid subtype predictor utilizing 506 genes
这三类LAD的过表达基因参与不同的生物功能,
Bronchioid – excretion genes, asthma genes, and surfactants (SFTPB, SFTPC, SFTPD);
Magnoid – DNA repair genes, such as thymine-DNA glycosylase (TDG);
Squamoid – defense response genes, such as chemokine ligand 10 (CXCL10)
而且也对应不同的临床数据
Bronchioid had the most females, nonsmokers, early stage tumors, and low grade tumors, the greatest acinar content, the least necrosis, and the least invasion.
Squamoid had the most high grade tumors, the greatest solid content, and the lowest papillary content.
Magnoid had themost smokers and the heaviest smokers by pack years.
它们的基因突变pattern也有很大区别。
Bronchioid had the greatest EGFR mutation frequency
Magnoid had the greatest mutation frequencies in TP53, KRAS and STK11.
为了研究不同亚型癌症的突变模式的不同(genomewide mutation rates),我们同时又研究了a large set of rarely mutated genes (n = 623) from the Ding et al. cohort
结论:
Bronchioid subtype 更有可能受益于EGFR inhibitory therapy
Magnoid tumors also have severe genomic alterations including the greatest CIN, the most regional CN alterations, DNA hypermethylation, and the greatest genomewide mutation rate.
the Squamoid subtype displayed the fewest distinctive alterations that included only regional CN alterations