21

使用Bedtools对RNA-seq进行基因计数

以前是没有想过用这个软件的,直到有一个我的htseq无法对比对的bam文件进行基因计数(后来我才发现htseq无法计数的原因是gtf版本不同导致坐标不同,而且gtf对染色体编号没有加上chr),我简单搜索了一下,发现bedtools multicov也有类似的功能,所以我选择它来试试看!

首先注意它需要sort的bam文件及bam的index

bedtools multicov depends upon index BAM files in order to count the number of overlaps in each BAM file. As such, each BAM file should be position sorted (samtool sort aln.bam aln.sort) and indexed (samtools index aln.sort.bam) with either samtools or bamtools.

首先安装它:

wget https://github.com/arq5x/bedtools2/releases/download/v2.23.0/bedtools-2.23.0.tar.gz

解压开后

Make clean

Make all

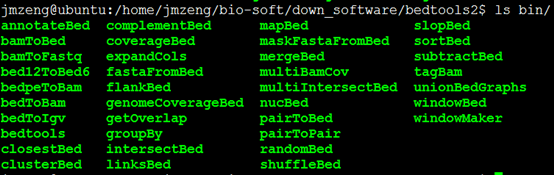
然后就可以看到它的bin目录下全部是程序啦

Bedtools使用笔记639

命令很简单的

bedtools multicov [OPTIONS] -bams BAM1 BAM2 BAM3 ... BAMn -bed  <BED/GFF/VCF>

By default, multicov will report the count of alignments in each input BAM file that overlap.

例子:

bedtools multicov -bams aln1.bam aln2.bam aln3.bam -bed ivls-of-interest.bed

ivls-of-interest.bed这个文件是必须的,可能需要自己制作,其实用gtf文件也可以的

chr1 0   10000   ivl1

chr1 10000   20000   ivl2

chr1 20000   30000   ivl3

chr1 30000   40000   ivl4

输出结果前三列是坐标,第四列是基因名,跟我们的bed文件一样,只是最后三列是三个样本的计数,是添加上来的!

chr1 0       10000   ivl1    100 2234    0

chr1 10000   20000   ivl2    123 3245    1000

chr1 20000   30000   ivl3    213 2332    2034

chr1 30000   40000   ivl4    335 7654    0


同样是对gene的reads计数,bedtools的multicov工具与htseq-count的区别是

i'd guess it's due to the fact that htseq-count only reports one hit per aligned read assuming that read is aligned uniquely and does not overlap multiple features listed in your GTF. if an aligned read hits more than one feature in your GTF then it doesn't report that hit. bedtools gives you raw hits which includes every 1 hit for every intersection of every alignment with any features in the GTF no matter how many times it aligned or how many features it hit. you might think, "wow, htseq-count is dropping a lot of information". yes, it is! i've moved to using other tools to count hits to genes (RSEM/eXpress) since they disambiguate those ambiguous alignments and as a result you get counts for all of your aligned reads. in a genome with alternative splicing you lose too much data using htseq-count, in my opinion.

而且专门有个文献在讨论这个问题

http://barcwiki.wi.mit.edu/wiki/SOPs/rna-seq-diff-expressions

http://www.nature.com/nbt/journal/v31/n1/abs/nbt.2450.html

Differential analysis of gene regulation at transcript resolution with RNA-seq

下面我讲一个实际的例子

我的bam文件如下

Bedtools使用笔记2406

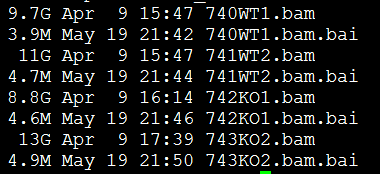
bedtools multicov -bams 740WT1.bam 741WT2.bam 742KO1.bam 743KO2.bam -bed mm9.bed

Bedtools使用笔记2491

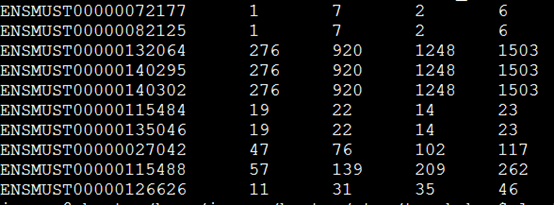
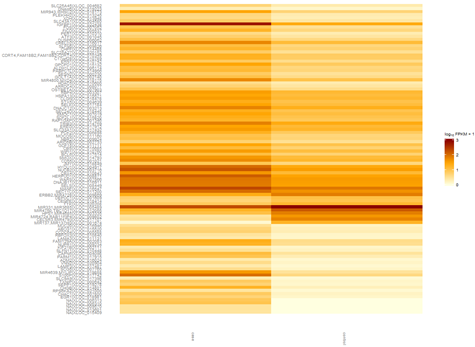
得到的这个矩阵就可以去用DESeq包来进行差异分析啦!

18

R语言DESeq找差异基因

一:安装并加装该R包

安装就用source("http://bioconductor.org/biocLite.R") ;biocLite("DESeq")即可,如果安装失败,就需要自己下载源码包,然后安装R模块。


二.所需要数据

它的说明书指定了我们一个数据

source("http://bioconductor.org/biocLite.R") ;biocLite("pasilla")

安装了pasilla这个包之后,在这个包的安装目录就可以找到一个表格文件,就是我们的DESeq需要的文件。

C:\Program Files\R\R-3.2.0\library\pasilla\extdata\pasilla_gene_counts.tsv

说明书原话是这样的

The table cell in the i-th row and the j-th column of the table tells how many reads have been mapped to gene i in sample j.

一般我们需要用htseq-count这个程序对我们的每个样本的sam文件做处理计数,并合并这样的数据

下面这个是示例数据,第一列是基因ID号,后面的每一列都是一个样本。

图片1

de = newCountDataSet( pasillaCountTable, condition )  #根据我们的样本因子把基因计数表格读入成一个cds对象,这个newCountDataSet函数就是为了构建对象!

对我们构建好的de对象就可以直接开始找差异啦!非常简单的几步即可

de=estimateSizeFactors(de)

de=estimateDispersions(de)

res=nbinomTest(de,"K","W") #最重要的就是这个res表格啦!

uniq=na.omit(res)

我这里是对4个样本用htseq计数后的文件来做的,贴出完整代码吧

library(DESeq)

#首先读取htseq对bam或者sam比对文件的计数结果

K1=read.table("742KO1.count",row.names=1)

K2=read.table("743KO2.count",row.names=1)

W1=read.table("740WT1.count",row.names=1)

W2=read.table("741WT2.count",row.names=1)

data=cbind(K1,K2,W1,W2)

data=data[-c(43630:43634),]

#把我们的多个样本计数结果合并起来成数据框,列是不同样本,行是不同基因

colnames(data)=c("K1","K2","W1","W2")

type=rep(c("K","W"),c(2,2))

#构造成DESeq的对象,并对分组样本进行基因表达量检验

de=newCountDataSet(data,type)

de=estimateSizeFactors(de)

de=estimateDispersions(de)

res=nbinomTest(de,"K","W")

#res就是我们的表达量检验结果

library(org.Mm.eg.db)

tmp=select(org.Mm.eg.db, keys=res$id, columns="GO", keytype="ENSEMBL")

ensembl_go=unlist(tapply(tmp[,2],as.factor(tmp[,1]),function(x) paste(x,collapse ="|"),simplify =F))

#首先输出所有的计数数据,加上go注释信息

all_res=res

res$go=ensembl_go[res$id]

write.csv(res,file="all_data.csv",row.names =F)

#然后输出有意义的数据,即剔除那些没有检测到表达的基因

uniq=na.omit(res)

sort_uniq=uniq[order(uniq$padj),]

write.csv(sort_uniq,file="sort_uniq.csv",row.names =F)

#然后挑选出padj值小于0.05的差异基因数据来做富集,富集用的YGC的两个包,在我前面的博客已经详细说明了!

tmp=select(org.Mm.eg.db, keys=sort_uniq[sort_uniq$padj<0.05,1], columns="ENTREZID", keytype="ENSEMBL")

diff_ENTREZID=tmp$ENTREZID

require(DOSE)

require(clusterProfiler)

diff_ENTREZID=na.omit(diff_ENTREZID)

ego <- enrichGO(gene=diff_ENTREZID,organism="mouse",ont="CC",pvalueCutoff=0.01,readable=TRUE)

ekk <- enrichKEGG(gene=diff_ENTREZID,organism="mouse",pvalueCutoff=0.01,readable=TRUE)

write.csv(summary(ekk),"KEGG-enrich.csv",row.names =F)

write.csv(summary(ego),"GO-enrich.csv",row.names =F)


17

转录组cummeRbund操作笔记

转录组cummeRbund操作笔记

这是跟tophat和cufflinks套装紧密搭配使用的一个R包,能出大部分文章要求的标准化图片。

一:安装并加装该R包

安装就用source("http://bioconductor.org/biocLite.R") ;biocLite("cummeRbund")即可,如果安装失败,就需要自己下载源码包,然后安装R模块。

转录组cummeRbund操作笔记220

然后把cuffdiff输出的文件目录拷贝到R的工作目录,或者自己设置工作目录


二:读取FN目录下面的所有文件。

转录组cummeRbund操作笔记239

可以看到把cuffdiff下面的文件夹所有的文件都读取到了,里面有如下文件,包括genes,isoforms,cds,tss这四种差异情况都读取了。

转录组cummeRbund操作笔记316


三:表达水平分布图

转录组cummeRbund操作笔记328

转录组cummeRbund操作笔记330
四、表达水平箱线图

csBoxplot(genes(cuff_data))

转录组cummeRbund操作笔记371
五、画基因表达差异热图

转录组cummeRbund操作笔记386

画出热图如下

转录组cummeRbund操作笔记396


六、得到差异的genes,isoforms,TSS,CDS等等


  • 得到上调下调基因列表

diffData <- diffData(myGenes )

转录组cummeRbund操作笔记430

转录组cummeRbund操作笔记474


只有一百个有表达差异的基因

转录组cummeRbund操作笔记490


最后贴出一个综合性的代码,算了,太浪费空间了,把整个空间搞得不好看,就不贴了。

这个代码可以自动运行出图;

转录组cummeRbund操作笔记3781

16

转录组edgeR分析差异基因

转录组edgeR分析差异基因

edgeR是一个研究重复计数数据差异表达的Bioconductor软件包。一个过度离散的泊松模型被用于说明生物学可变性和技术可变性。经验贝叶斯方法被用于减轻跨转录本的过度离散程度,改进了推断的可靠性。该方法甚至能够用最小重复水平使用,只要至少一个表型或实验条件是重复的。该软件可能具有测序数据之外的其他应用,例如蛋白质组多肽计数数据。可用性:程序包在遵循LGPL许可证下可以从Bioconductor网站。

一:下载安装该软件

下载安装edgeR这个R包,因为这是一次讲R包的下载,我就啰嗦一点,这种生物信息学的包不同于普通的R包,是需要用biocLite来安装的,命令如下

转录组edgeR分析差异基因304


Continue reading

16

转录组HTseq对基因表达量进行计数

转录组HTseq对基因表达量进行计数

一:下载安装该软件

下载htseq这个python模块安装解压包,依赖于很多python的其它安装包及库,模块,我最讨厌python了,在有些电脑上特别难安装,而且服务器还有权限的问题。

解压进入该目录,输入 python setup.py   install  --user  记住,是- - 而不是—

这样只是把这个软件安装到自己的目录

安装完毕后,会出现这两个程序,在自己的python库里面,可以直接调用这两个程序的,我这里它们的路径是 .local/bin ,很奇怪的一个路径,我也是用find命令才找到的

转录组HTseq对基因表达量进行计数451

Continue reading