Here we describe the Cancer Cell Line Encyclopedia (CCLE): a compilation of gene expression, chromosomal copy number, and massively parallel sequencing data from 947 human cancer cell lines.
收集了三种数据:
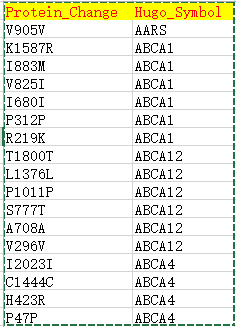
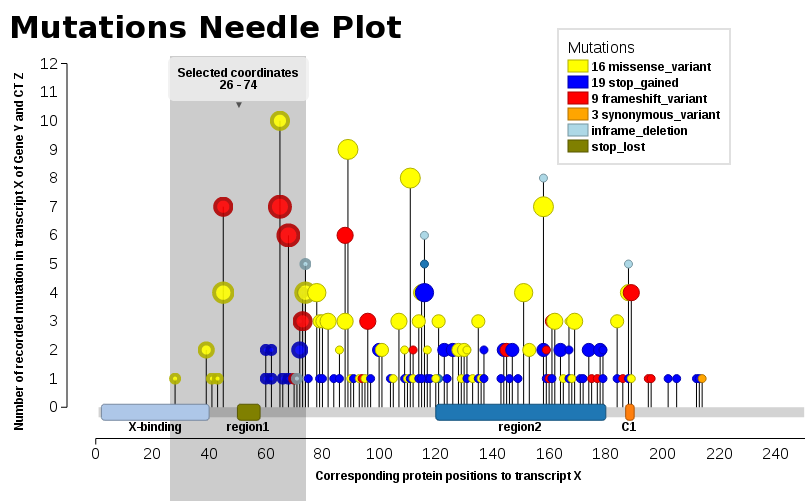
The mutational status of >1,600 genes was determined by targeted massively parallel sequencing, followed by removal of variants likely to be germline events .
Moreover, 392 recurrent mutations affecting 33 known cancer genes were assessed by mass spectrometric genotyping13 .
DNA copy number was measured using high-density single nucleotide polymorphism arrays (Affymetrix SNP 6.0; Supplementary Methods).
Finally, mRNA expression levels were obtained for each of the lines using Affymetrix U133 plus 2.0 arrays.
These data were also used to confirm cell line identities .
一般用得最多的就是表达数据,因为表达数据最简单,大多数生物信息学分析着只会用这个数据!
而它的突变数据又不是通常意义的高通量测序得到的,snp6芯片数据很多人听都没听过
文章的附件有对cell lines的具体描述。
CCLE的数据在broad institute里面可以下载,也放在GEO数据库里面,我比较喜欢GEO里面的数据
This SuperSeries is composed of the following SubSeries:
GSE36133 Expression data from the Cancer Cell Line Encyclopedia (CCLE)
GSE36138 SNP array data from the Cancer Cell Line Encyclopedia (CCLE)
GSE36133这个study的metadata里面有对每个cellline来源的cancer进行描述!
有人喜欢把这个metadata叫做是clinical data。
library(GEOquery)
ccleFromGEO <- getGEO("GSE36133")
annotBlock1 <- pData(phenoData(ccleFromGEO[[1]]))
>dim(annotBlock1)
[1] 917 38
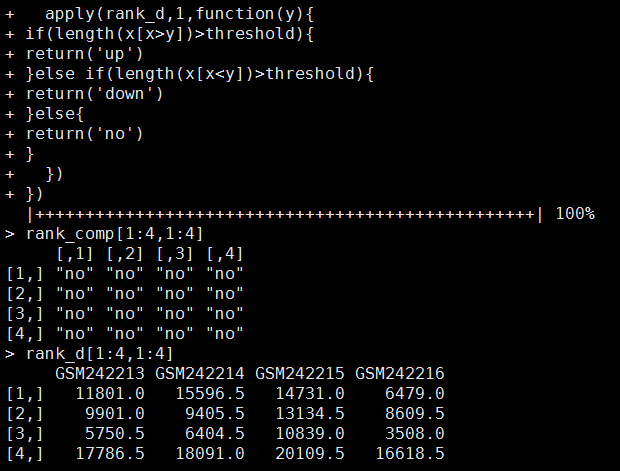
exprSet=exprs(ccleFromGEO[[1]])
> dim(exprSet)
[1] 18926 917
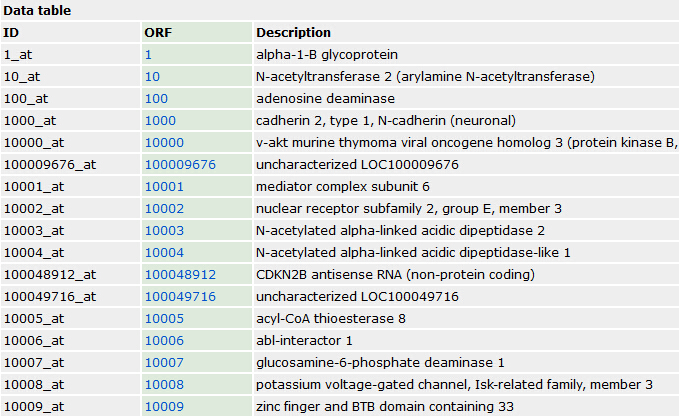
##它的表达数据矩阵,包含了18926个基因,列名是917个细胞系的名字,行是基因的entrez ID
keyColumns <- c("title", "source_name_ch1", "characteristics_ch1", "characteristics_ch1.1",
"characteristics_ch1.2")
options(stringsAsFactors = F)
allAnnot=annotBlock1[,keyColumns]
##这几列信息是比较重要的metadata,里面详细记录了细胞系的收集公司单位,tissue,癌症分类等信息
Cell line (1035个细胞系简介)Gene Sets
1035 sets of genes with high or low expression in each cell line relative to other cell lines from the CCLE Cell Line Gene Expression Profiles dataset.
一些关于CCLE数据库的文章:
Anticancer drug sensitivity analysis: An integrated approach applied to Erlotinib sensitivity prediction in the CCLE database
![[DIR]](file:///C:/Users/jmzeng/AppData/Local/YNote/data/jmzeng1314@163.com/901f79782af94aecb22c22dcb42c10a4/folder.gif)