之前用过有界面的那种,那样非常方便,只需要做好数据即可,但是如果有非常多的数据,每次都要点击文件,点击下一步,也很烦,不过,,它既然是java软件,就可以以命令行的形式来玩转它!
能够命令行运行了,就很容易批量啦
一、程序安装
直接在官网下载java版本软件即可:http://software.broadinstitute.org/gsea/downloads.jsp
二、输入数据
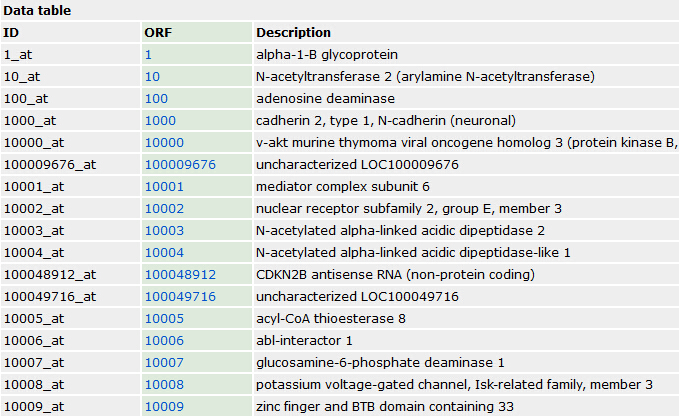
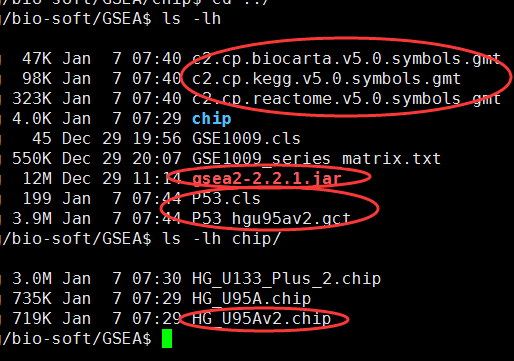
需要下载gmt文件,自己制作gct和cls文件,或者直接下载测试文件p53
见:http://www.broadinstitute.org/cancer/software/gsea/wiki/index.php/Data_formats
三、运行命令
hgu95av2的芯片数据,只有一万多探针,所以很快就可以出结果
java -cp gsea2-2.2.1.jar -Xmx1024m xtools.gsea.Gsea -gmx c2.cp.kegg.v5.0.symbols.gmt \
-res P53_hgu95av2.gct -cls P53.cls -chip chip/HG_U95Av2.chip -out result -rpt_label p53_example
但是一般我们都用默认的即可
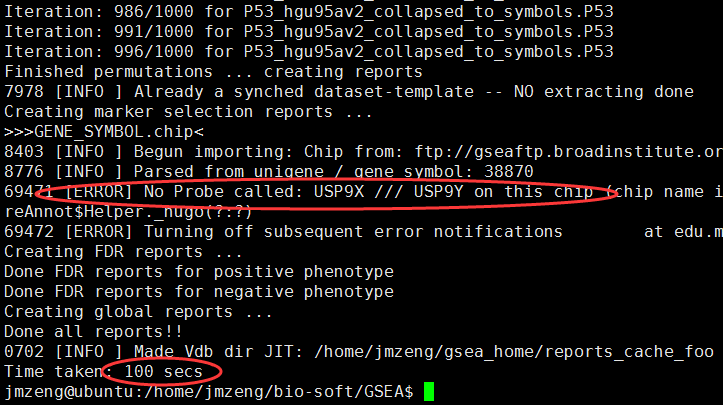
里面报错说有些探针找不到,不要管它
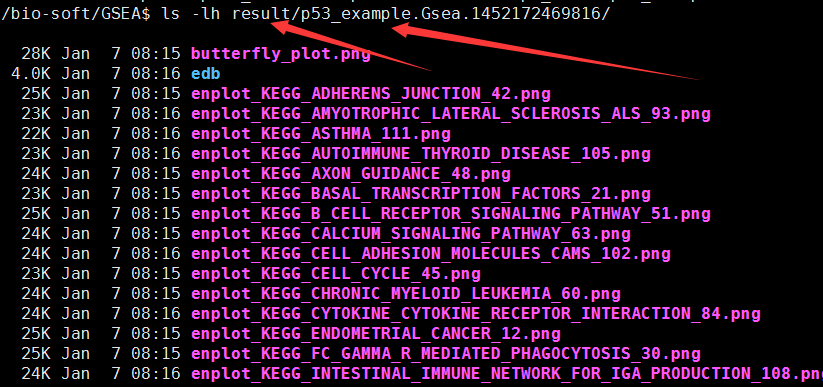
四、输出数据
自己看官网去理解这些结果咯!
需要下载的数据如下:
首先需要下载 Molecular Signatures Database (MSigDB),一般选择C2的kegg,BioCarta 还有Reactome
都是gmt格式的文件!
| CP: Canonical pathways (browse 1330 gene sets) |
Gene sets from the pathway databases. Usually, these gene sets are canonical representations of a biological process compiled by domain experts. details | Download GMT Files original identifiers gene symbols entrez genes ids |
|---|---|---|
| CP:BIOCARTA: BioCarta gene sets (browse 217 gene sets) |
Gene sets derived from the BioCarta pathway database (http://www.biocarta.com/genes/index.asp). | Download GMT Files original identifiers gene symbols entrez genes ids |
| CP:KEGG: KEGG gene sets (browse 186 gene sets) |
Gene sets derived from the KEGG pathway database (http://www.genome.jp/kegg/pathway.html). | Download GMT Files original identifiers gene symbols entrez genes ids |
| CP:REACTOME: Reactome gene sets (browse 674 gene sets) |
Gene sets derived from the Reactome pathway database (http://www.reactome.org/). | Download GMT Files original identifiers gene symbols entrez genes ids |
然后做出表达数据gct文件和cls表型文件~
然后就可以直接运行了
如果是芯片数据,第一列是芯片探针,那么还需要下载chip数据:ftp://ftp.broadinstitute.org/pub/gsea/annotations