前面我们的明码标价之普通转录组上游分析,受到了各大热心粉丝的吐槽,觉得太简单了我们居然还好意思收费。后面我就就加上了稍微有一点难度的《可变剪切》,不过仍然是阻挡不了粉丝无穷无尽的需求,后台有人发给我一个RNA-Seq数据的内含子保留分析需求。
我看了看粉丝发过来的文章,发表于 January 2021, 在CELL杂志的文章《Spliceosome-targeted therapies trigger an antiviral immune response in triple-negative breast cancer》,链接是:https://doi.org/10.1016/j.cell.2020.12.031
这个文章数据比较多:
SUM159 SD6 RNA-Seq #GSE163414
LM2 SD6 RNA-Seq #GSE163411
SUM159 Cytoplasmic RNA-Seq #GSE163232
SUM159 J2 dsRIPseq #GSE163188
Syngeneic model RNA-Seq #GSE163181
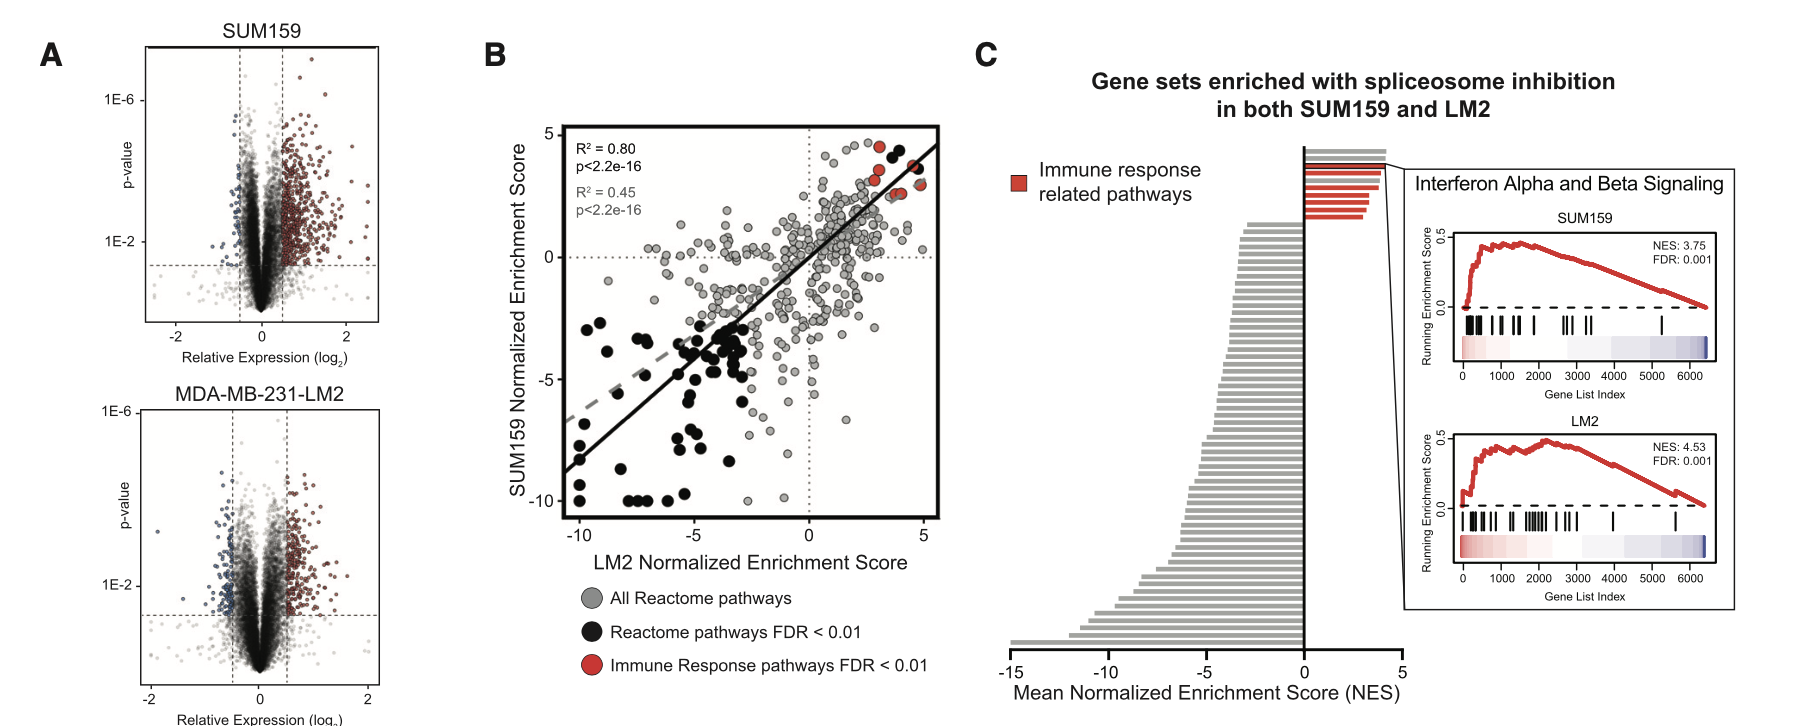
可以看到,主要是RNA-Seq数据啦,有两个是普通的细胞系处理前后的表达量差异情况探索,所以出图如下:
这个已经是超级简单了, 我们的明码标价之转录组常规测序服务(仅需799每个样品) 和 明码标价之普通转录组上游分析 就是对这样的 RNA-Seq拿到了表达量矩阵,然后下游分析也是平淡无奇,仅收费800,代码呢,我也多次分享了,基本上看我六年前的表达芯片的公共数据库挖掘系列推文即可;
- 解读GEO数据存放规律及下载,一文就够
- 解读SRA数据库规律一文就够
- 从GEO数据库下载得到表达矩阵 一文就够
- GSEA分析一文就够(单机版+R语言版)
- 根据分组信息做差异分析- 这个一文不够的
- 差异分析得到的结果注释一文就够
这样的分析流程基本上绝大部分粉丝已经是无需委托我们啦,所以粉丝发给我的是 RNA-Seq数据的内含子保留分析需求,步骤如下:
- Hisat2-aligned reads were filtered for proper-paired reads (-f 2 flag in SAMtools).
- Intron annotations were parsed from UCSC RefSeq gene annotation files and were filtered to exclude features that overlap genomic loci on the same strand.
- Reads mapping to introns were counted using Pysam.
- For each intron feature, we defined the following two read classes:
- (1) ‘‘intronic’’ reads mapping at least 6 bases contiguously within the intron
- (2) ‘‘spanning’’ reads with ends mapping to the flanking exons.
- The intron retention (IR) score was then computed as the ratio of the RPKM-normalized ‘‘intronic’’ read density over the RPKM-normalized ‘‘spanning’’ read den- sity.
- In order to compare commonly expressed IR events across samples, introns with < 10 spanning RPKM in any sample were excluded from all analyses.
对我们有ngs组学数据分析经验的人来说,其实并不难,无非就是安装几个软件,使用几个包。但对于没有学过编程的纯生物学研究者来说基本上不可能完成,也没有这样的网页工具。
但是呢,这个流程又确实是过于个性化,哪怕对我们来说很简单,也其实是耗费时间和精力需要研发调试的。
首先你需要有RNA-seq的fastq文件
如果是TCGA数据库,步骤如下:
- Intron retention analysis was performed on BRCA TCGA RNA sequencing datasets (Koboldt et al., 2012).
- TCGA fastq reads were mapped using the STAR aligner (v2.3.1) (Dobin et al., 2013) onto the hg19/GRCh37 reference genome as previously described (Hsu et al., 2015).
- Level of intron retention (IR level) within each sample was calculated as the number of introns with IR scores > 0.01, as defined previously.
- ‘‘High’’ and ‘‘Low’’ IR were defined as having an IR level outside one standard deviation of the mean.
- RSEM normalized gene expression data from TCGA was obtained from the Broad GDAC Firehose.
一般来说,大家是很难下载TCGA数据库原始fastq文件,这个权限审核比较严厉,不过咱们数据挖掘呢完全没有毕业一直盯着TCGA数据库啊,自己领域的普通RNA-seq肯定也是不少。如果是认真搞科研,你一定会自行调研和阅读文献,找到合适的数据集。
数据挖掘的核心就是通过分类把基因数量搞少
部分粉丝看到这里,可能无法理解RNA-Seq数据的内含子保留分析的意义是什么?
其实就是多了一个维度的指标,来把你的样本分类,分类后就可以找差异。同样的我们可以看这个示例文章,感觉每个样品的IR指标,把病人分成IR高低两个组别,然后走普通的ssGSEA分析,生存分析。
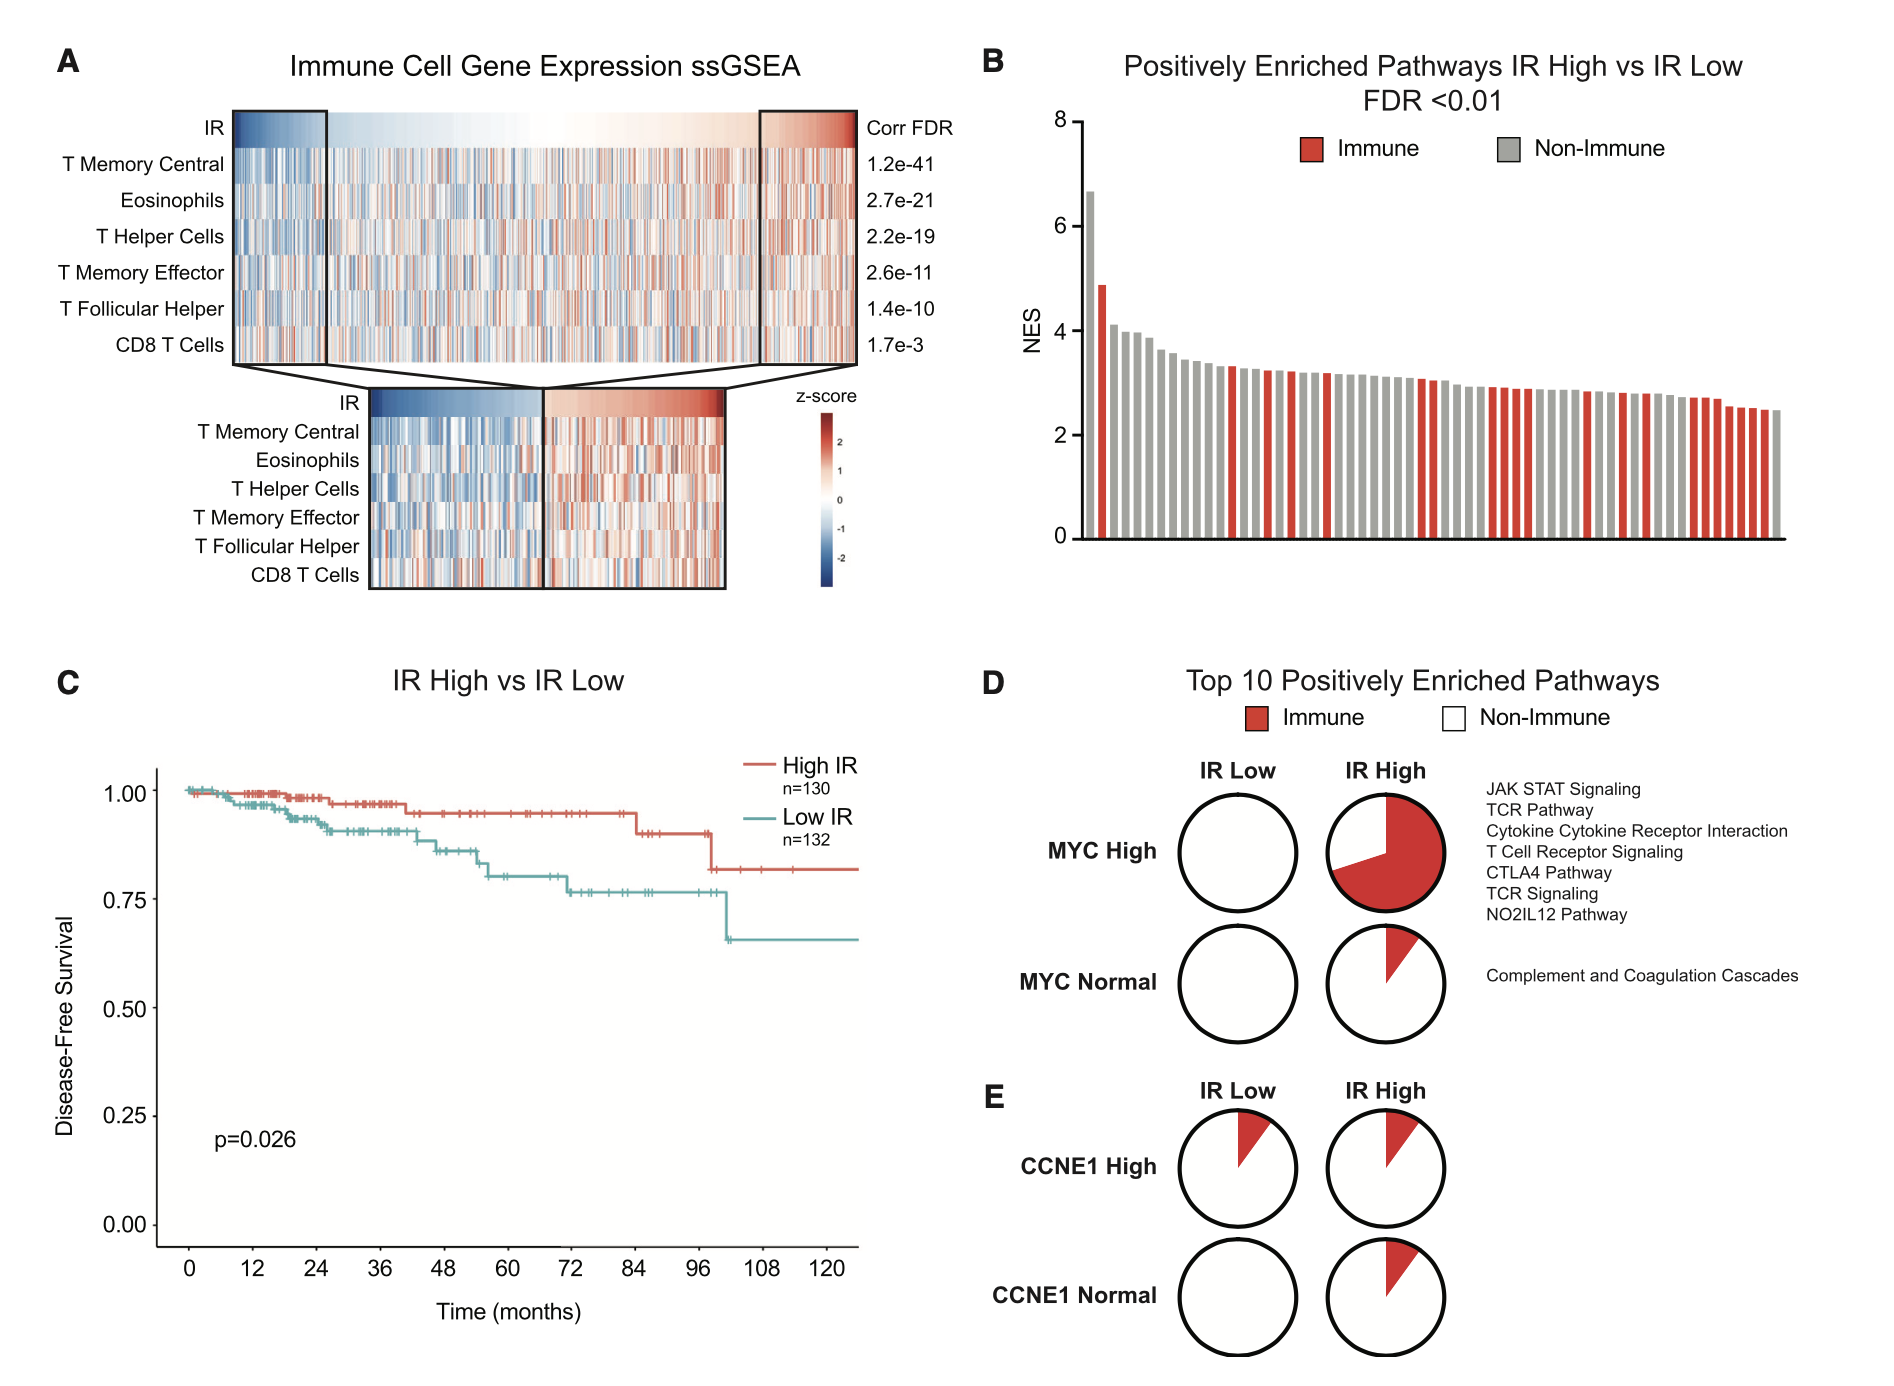
这一套组合拳,大家是不是很眼熟啊?
如果你也想做自己的的RNA-Seq数据的内含子保留分析,赶快联系我们吧,同样的,我们的分析仍然是明码标价,单个RNA-Seq数据的内含子保留分析收费仅需800元,因为是纯粹的基于Linux平台的各种软件脚本,所以提供你全套数据和脚本但是无法保证你能运行成功,因为你不一定有自己的服务器。