最近看到文章 Cancer Cell . 2020 Dec ,标题是《Cathepsin C promotes breast cancer lung metastasis by modulating neutrophil infiltration and neutrophil extracellular trap formation》
链接是:https://pubmed.ncbi.nlm.nih.gov/33450198/ 有一个图表很适合布置给学徒作为作业。
研究者对荷兰癌症研究所(NKI)发表的乳腺癌基因表达数据进行分析,绘制出来了如下所示的单样本的gsea分析图表:
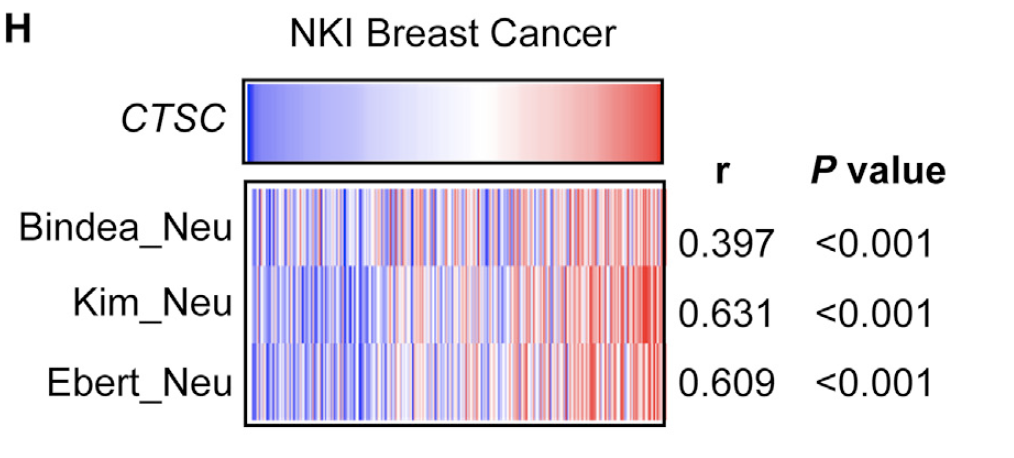
图例是:(H) Single-sample gene set enrichment analysis of CTSC correlation to neutrophil-related gene sets in the NKI dataset (n = 295). Scale bar, 50 mm. p values were obtained by two-tailed unpaired t test (B, E, and F) or Pearson’s correlation analysis (others)
我看了看文章:
- The NKI microarray data and clinical information were obtained from previous publications (Minn et al., 2007; van de Vijver et al., 2002).
- The enrichment of neutrophilrelated gene sets in these tumors were analyzed by ssGESA in GenePattern platform with the previously published neutrophil gene sets (Bindea et al., 2013; Ebert et al., 2008; Kim et al., 2019). These gene sets are listed in Table S6.
- Download spreadsheet (13KB) ,Table S6. Gene sets used for single-sample gene set enrichment analyses, related to the STAR methods.
数据分析大纲
- 下载表达量矩阵
- 读文献拿到3个基因集的基因列表
- 针对基因列表去表达量矩阵里面走ssGSE分析
- 对ssGSE分析值与CTSC表达量进行相关性计算
- 绘制热图
老规矩,学徒作业需要以markdown形式,描述清楚你的分析过程,并且发邮件到我邮箱