前面我们介绍了一些背景知识,主要是理解什么是DNA甲基化,为什么要检测它,以及芯片和测序两个方向的DNA甲基化检测技术。具体介绍在:甲基化的一些基础知识,也了解了甲基化芯片的一般分析流程 。
但是我留下了一个疑问给读者,就是甲基化信号值矩阵的差异分析策略抉择问题。而且甲基化信号值矩阵有3个层次的差异分析:DMP,DMR,DMB:
- DMP代表找出Differential Methylation Probe(差异化CpG位点)
- DMR代表找出Differential Methylation Region(差异化CpG区域)
- Block代表Differential Methylation Block(更大范围的差异化region区域)
简单来说,DMP是找出一个一个的差异甲基化CpG位点,DMR就是一个连续不断都比较长的差异片段,科学家们觉得,这样的连续差异片段,对于基因的影响会更加明显,只找这样的片段,可以使得计算生物学的打击精度更为准确,也可以让最终找出来的结论数据更少,便于实验人员筛选。另外一个类似的东西就是DMB,那个东西出现的原因是,有的科学家觉得,DMR这样的区域还不够显著,DNA上的甲基化出现变化,可能是绵延几千位点的!
目前甲基化信号值矩阵差异分析的R包非常多,比如 IMA, minfi, methylumi, RnBeads and wateRmelon,以及我们一直强推的ChAMP!现在就让我们一起来看看多种多样的甲基化信号值矩阵差异分析的R包,以及主流文献使用的策略吧!ChAMP
提到甲基化信号值矩阵的差异分析,不得不强推
ChAMP这个分析(一站式)450K甲基化芯片数据的R包作者,我们生信技能树也多次推送过相关教程。比如850K甲基化芯片数据的分析 在谷歌搜索该包的引用就知道ChAMP的流行程度啦,一般文章描述ChAMP使用如下:
Raw output from the Infinium HumanMethylation450 BeadChip Kit (Illumina) was downloaded from TCGA (n = 80), and combined with our own cases (n = 7) and analyzed using the ChAMP R package. - The top 20% most variable methylation probe β-values were used for unsupervised PCA analysis using the stats and rgl R packages.
- Phylogenetic evolutionary models were generated using the minimum evolution algorithm (Canberra distance) in the ape R package.
- Likelihoods of each bipartition in the tree were calculated using bootstrapping with 100 replicates.
差异分析本身并不难,因为都被ChAMP作者包装好了,一个简单的函数即可。就是去GEO数据库的数据集把矩阵下载下来,读入R,加上临床信息然后走下面的代码,核心步骤就是 champ.DMP 函数:# 下面的beta.m是甲基化矩阵,pD 是表型信息 myLoad=champ.filter(beta = beta.m ,pd = pD) myNorm <- champ.norm(beta=myLoad$beta,arraytype="450K",cores=5) group_list=myLoad$pd$group myDMP <- champ.DMP(beta = myNorm,pheno=group_list)难的是对差异分析结果的解释和进一步下游分析。我们前些天的推文简单罗列了一些分析图表;甲基化信号值矩阵差异分析主要图表
minfi的dmpFinder函数
因为minfi使用自定义对象包装好了一切,所以非常方便,比如也可以使用前面我们champ流程拿到的甲基化信号值矩阵,差异分析也使用它包装好的dmpFinder函数即可,用法如下:
beta.m=myNorm
# 后续针对 beta.m 进行差异分析, 比如 minfi 包
grset=makeGenomicRatioSetFromMatrix(beta.m,what="Beta")
M = getM(grset)
# 因为甲基化芯片是450K或者850K,几十万行的甲基化位点,统计检验通常很慢。
dmp <- dmpFinder(M, pheno=group_list, type="categorical")
dmpDiff=dmp[(dmp$qval<0.05) & (is.na(dmp$qval)==F),]
dim(dmpDiff)
其实dmpFinder函数就是limma的一个包装,如果你仔细看源代码的话就理解了。当然了,minfi自定义的加载idat文件后的GRset.funnorm对象,也是可以从这个对象里面拿到甲基化信号值矩阵和临床信息!
我多次比较过minfi的dmpFinder函数和champ流程拿到的差异化甲基化探针的区别,一致性非常好。所以这里我们没必要纠结于使用哪一个R包啦,反正都差不多,当然使用champ啦!limma,经典中的经典
使用limma对甲基化信号值矩阵做差异分析,其实是受到了RNA-seq或者表达芯片矩阵的影响。通常我并不会这样选择,但是你肯定会看到很多文章这样使用,值得注意的是,这个时候limma计算的logFC是没有实际直接生物学意义的,不建议用它作为差异分析的筛选指标哦!
然后是 COHCAP 包
比如发表在 September 27, 2017 文章 https://www.spandidos-publications.com/ol/14/6/7171 题目是Identification of potentially critical differentially methylated genes in nasopharyngeal carcinoma: A comprehensive analysis of methylation profiling and gene expression profiling的文章就采用了它!
- 两个 (GSE52068 and GSE62336) 甲基化数据,得到1,676 hypermethylated genes, 28 hypomethylated genes, 17 DMIs
Prediction of DMRs and DMIs
DMRs between NPC and normal samples were predicted using COHCAP package. Briefly, based on the β-value file of CpG site probes, Δβ, P-value and adjusted P-value of NPC and normal samples were calculated by COHCAP. Only regions with |Δβ|>0.1 and adjusted P<0.05 were identified as DMRs.
Furthermore, the COHCAP package was also utilized to predict DMIs. CpG island statistics were calculated by averaging β-values among samples per site and comparing the average β-values across groups. If the number of DMRs in the CpG island was >4, this CpG island was identified as a DMI.
这个R包也可以写一个教程,详细用法,需要研读说明书,真心不友好,我也不推荐它!然后是 IMA包
发表在 文章,An 11‐gene‐based prognostic signature for uveal melanoma metastasis based on gene expression and DNA methylation profile
其实champ和minfi都是跟它比较过,在发表champ和minfi的文章里面,你就可以看到。

同样的,既然有了champ和minfi,也没有必要选择IMA啦。然后是自定义差异化甲基化信号探针鉴定
比如2017的cancer cell发表的甲基化信号值对癌症进行分类的研究,仅仅是关注启动子区域的甲基化探针。

再比如:https://www.spandidos-publications.com/ol/9/4/1691 ,甲基化信号值的解释很清晰,而且过滤策略也说明了。
he β-value was calculated by subtracting the background signals using negative controls on the array and determining the ratio of the methylated signal intensity against the sum of the methylated and unmethylated signals. A β-value of 0–1.0 was reported as a significant percentage of methylation, 0–100%, respectively, for each CpG site. Array CpG probes with a detection P-value of ≥0.05, similar to the signal to noise ratio, in >50% samples were filtered out. A filtering criterion was applied for data analysis; a good signal value was required to obtain a detection P-value of <0.05. Filtered data was normalized using the quantile method. Differential methylation was determined based on |Δ_mean| ≥0.2 (difference in methylation signal = average β of case - average β of control).
这个时候作者似乎并没有去考虑统计学检验的P值,仅仅是看甲基化信号值的平均值的差。以基因为单位
这个时候无需考虑450K芯片的那四十多万探针了,只需考虑2万个基因的特定区域,比如启动子区域的多个甲基化探针的综合指标,最后转换为以基因为最小量化单位的甲基化信号值基因矩阵。而不是最开始的甲基化信号值探针矩阵来做差异分析。
比如文章:Epigenetic signature of differentially methylated genes in cutaneous melanoma 提到
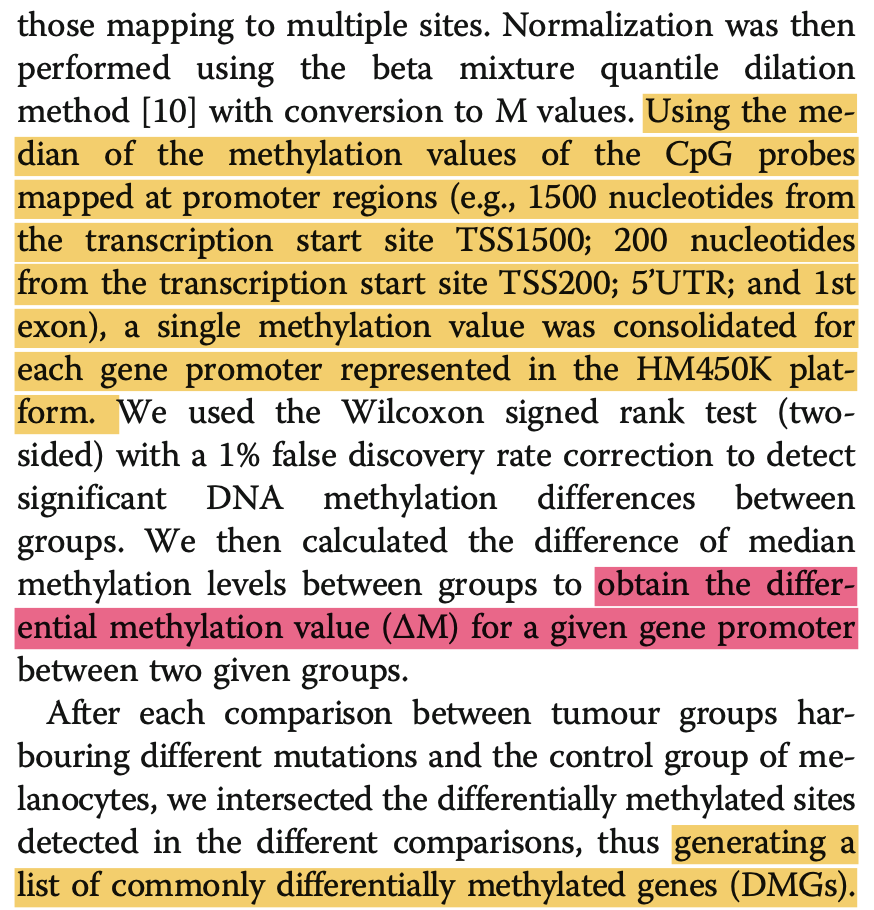
这个时候,需要一定的生物学背景,判断启动子区域的范围,以及如何衡量一个基因的启动子区域的多个甲基化探针的信号值的归一化和汇总。还有charm包+limma
文章:Relationship of DNA Methylation and Gene Expression in Idiopathic Pulmonary Fibrosis
Data quality for CHARM arrays was assessed using the quality control functions in the charm R package (28), principal components analysis, and probabilistic estimation of expression residuals factors (29, 30). Normalized percent methylation estimates (range, 0–1) at each of the 2.1 million probes were used in all downstream analyses after logit transformation. The R package limma (31) was used to fit linear models for methylation data and P values were based on the moderated t statistic. From this, DMRs were identified from those P values using comb-p (32) with a window size of 300 bases and a corrected P value of less than 0.05 (corresponding to α < 5% after correcting for the number of possible DMRs). This resulted in regions of adjacent probes with low P values that stand up to genome-wide correction. Regions were annotated to nearest gene and CpG island from human genome version hg18 with CruzDB (33).
这个流程就有点老旧了,如果作者当时可以选择champ和minfi,就不至于这么辛苦自己组合多个R包方法了。扩展阅读:甲基化测序
甲基化测序也是可以通过一系列流程,最后拿到甲基化信号值矩阵啦。
Bisulfite sequencing (BS-seq) is the current “gold-standard” technology for high-resolution profiling of DNA methylation.
Reduced representation bisulfite sequencing (RRBS) is an efficient form of BS-seq that targets CpG-rich DNA regions in order to save sequencing costs.
差异分析其实可以使用RNA-seq表达矩阵的包,比如edgeR,在bioconductor还有教程:https://f1000research.com/articles/6-2055文末友情宣传
强烈建议你推荐给身边的博士后以及年轻生物学PI,多一点数据认知,让他们的科研上一个台阶:
- 全国巡讲全球听(买一得五) ,你的生物信息学入门课
- 生信技能树的2019年终总结 ,你的生物信息学成长宝藏
- 2020学习主旋律,B站74小时免费教学视频为你领路