一般大家拿到表达矩阵都是走标准分析流程,火山图,热图,GO/KEGG数据库注释等等。这些流程的视频教程都在B站和GitHub了,目录如下:
- 第一讲:GEO,表达芯片与R
- 第二讲:从GEO下载数据得到表达量矩阵
- 第三讲:对表达量矩阵用GSEA软件做分析
- 第四讲:根据分组信息做差异分析
- 第五讲:对差异基因结果做GO/KEGG超几何分布检验富集分析
- 第六讲:指定基因分组boxplot指定基因list画热图
感兴趣可以细读表达芯片的公共数据库挖掘系列推文 ;
- 解读GEO数据存放规律及下载,一文就够
- 解读SRA数据库规律一文就够
- 从GEO数据库下载得到表达矩阵 一文就够
- GSEA分析一文就够(单机版+R语言版)
- 根据分组信息做差异分析- 这个一文不够的
- 差异分析得到的结果注释一文就够
不管是哪种表达矩阵得到的差异分子,以前的mRNA的基因名,或者miRNA,lncRNA,甚至circRNA的ID ,看起来很陌生的ID,都是同样的的分析流程。
但是上面的分析流程已经是烂大街,其实你的表达矩阵还是可以有很多花样的。比如最近发表的文章:2019 Jun 4. doi: 10.1080/2162402X.2019.1617588 题目很长:Immune microenvironment profiling of gastrointestinal stromal tumors (GIST) shows gene expression patterns associated to immune checkpoint inhibitors response 但实际上就是在分析癌症病人的表达矩阵而已,Gene expression profiles (GEP) from 31 KIT/PDGFRA-mutant GIST(gastrointestinal stromal tumors),让我们一起来看看他们分析了哪些吧。
芯片和测序技术都可以得到表达矩阵
- For the RNA-seq samples, the cDNA libraries were synthesized starting from 250 ng total RNA with TruSeq RNA Sample Prep Kit v2 (Illumina, San Diego, CA, USA) following the manufacturer’s protocol. HiScanSQ sequencer (Illumina) was used to generate sequences at 75bp in paired-end mode yielding an average of 61 million mapped reads/sample, reaching an average coverage of 44X. Read pairs were mapped on reference human genome and the gene expression was quantified using kallisto adopting the transcript per million (TPM) normalization.
- For microarray samples, the RNA was quality-controlled and labeled as indicated by the Affymetrix expression technical manual and then hybridized to HG-U133Plus 2.0 arrays. Gene expression data were normalized and quantified by the RMA algorithm (package oligo, R-bioconductor).
大家可以自行阅读文献看看作者是否公布了表达矩阵,可以尝试模仿同样的分析步骤,当然了,你有自己的数据走这个分析就更好了。
不同类型技术产生的表达矩阵走CIBERSORT需要注意区别
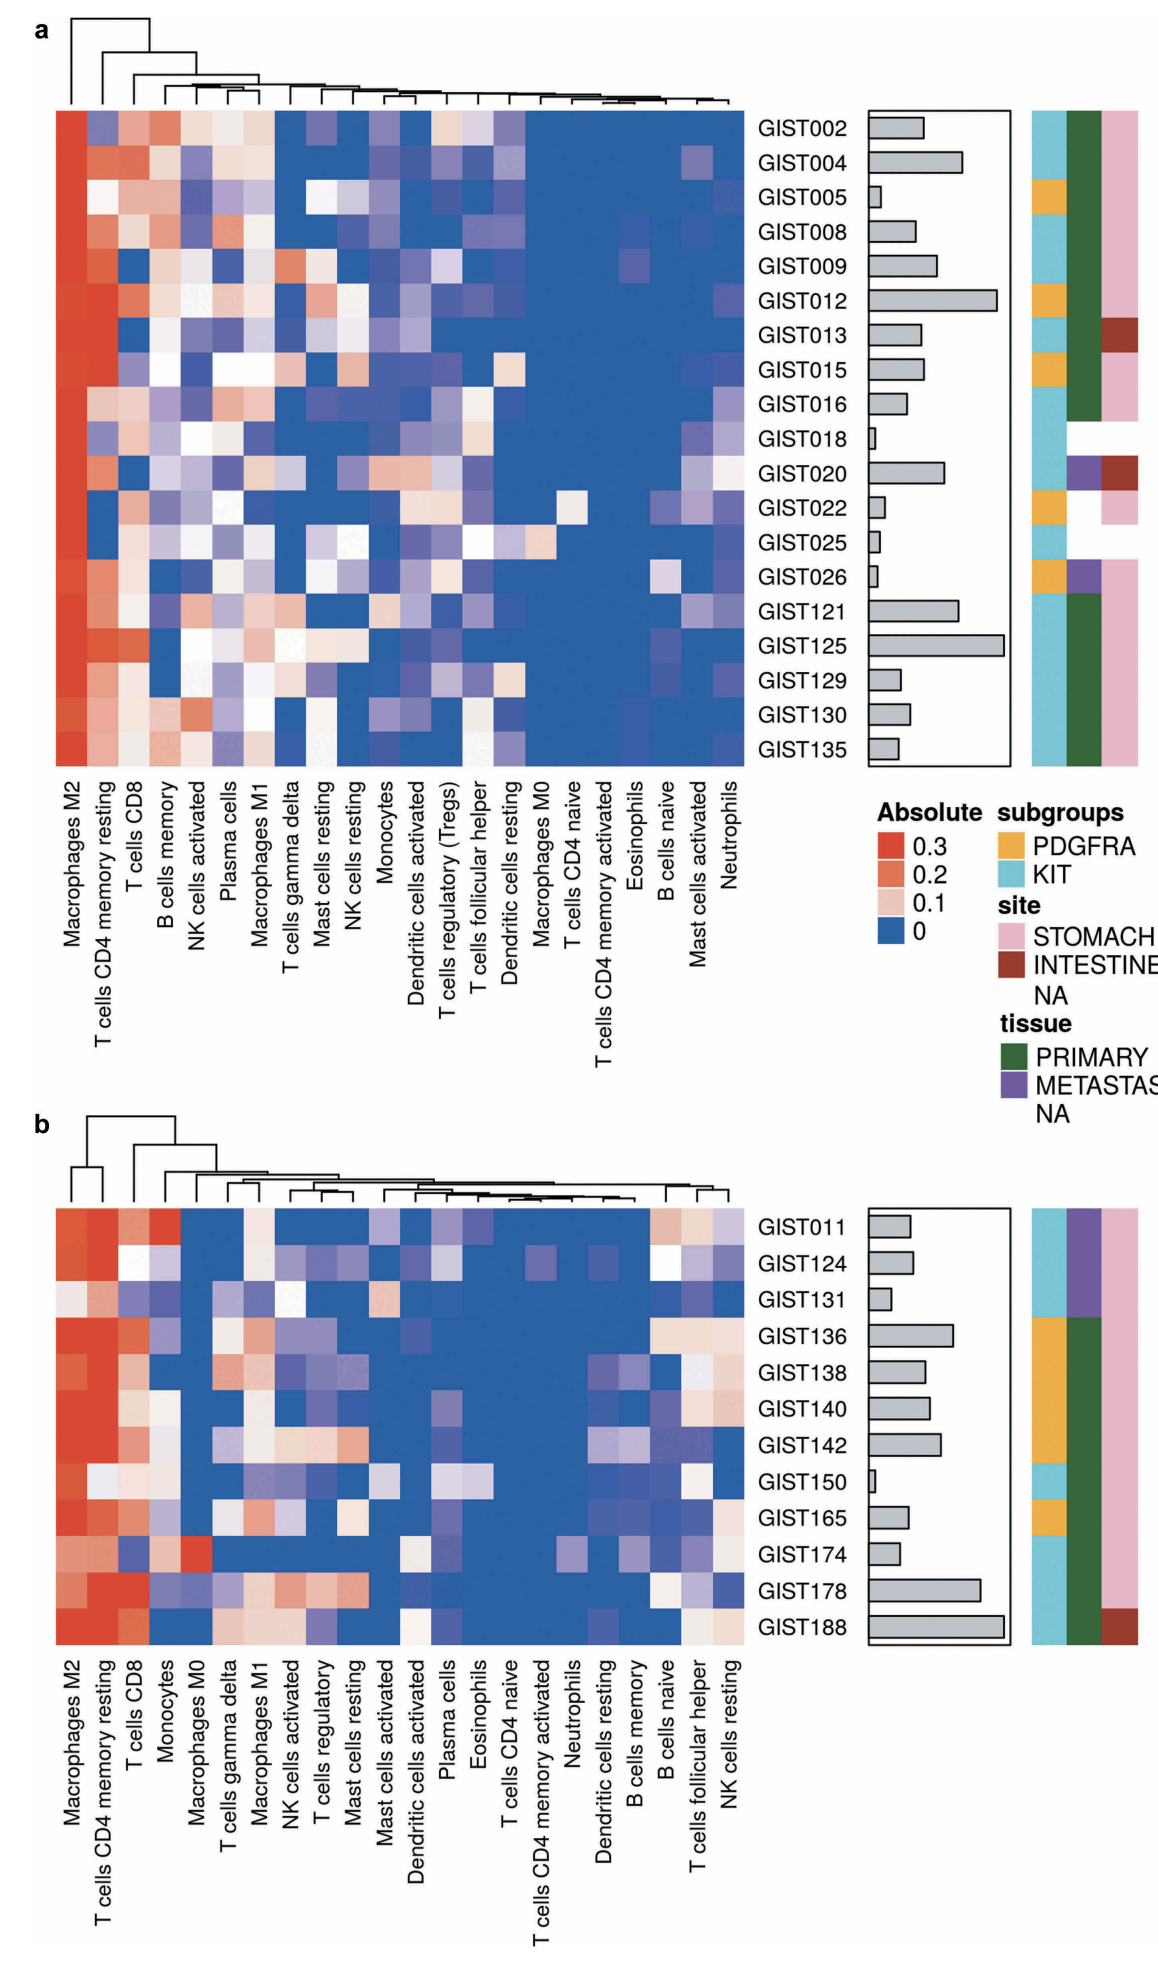
- The analytical tool CIBERSORT (Cell-type Identification By Estimating Relative Subsets Of RNA Transcripts)35 was applied on 31 tumors samples that were analyzed either with Affymetrix Array (19 samples) or Illumina whole transcriptome sequencing (12 samples) as described in Table 1.
- CIBERSORT uses a set of 22 immune cell reference profiles to derive a signature matrix which can be applied to deconvolute mixed samples in order to determine relative proportions of immune cells. Even if the CIBERSORT algorithm was originally developed using microarray data, it was declared as “platform agnostic”36 and, therefore, applicable to both Affymetrix and Illumina data.
- The analysis was performed separately for the two set of data obtained with different techniques (microarray and RNA-seq).
- For each set, an unsupervised hierarchical clustering analysis was adopted using the CIBERSORT absolute estimation with the aim to evaluate the variability of the main microenvironment cells subpopulations.
可以看到两不同类型技术产生的表达矩阵走CIBERSORT分析得到 22 immune cell 组成比例分布情况类似。
表达量的归一化也不一样
- The transcript quantification data were first normalized and log2 transformed either with quantile normalization or log2TPM calculation respectively for microarray and RNA-seq data.
- An additional normalization was performed by subtracting the arithmetic mean of ten housekeeping gene expression (Supplementary Table S7).
这些知识点大家需要自行阅读我们以前推文慢慢学习了咯!