前面我们介绍了单细胞转录组表达矩阵可以推断CNV的文献出处及历史,也简单过了broad开发的inferCNV软件,在其提供的测试数据上面成功运行了,也测试了airway这个转录组数据,还测试了CCLE数据库的RNA-seq和microarray数据,发现效果都不好,也暂时没能搞清楚问题出在哪里。
因为前面测试的都是bulk数据,但是这个软件毕竟是为了单细胞转录组数据而开发的,所以我首先找了一个R包 scRNAseq 自带的数据,得到的结果还行,但是没有验证。
library(scRNAseq)
data(fluidigm)
exprSet=assays(fluidigm)$rsem_counts
library(edgeR)
exprSet=log(cpm(exprSet)+1)
boxplot(exprSet[,1:5],las=2)
exprSet[1:4,1:4]
pos = read.table('../airway/human.gene.positions')
head(pos)
exprSet=exprSet[rownames(exprSet) %in% pos[,7],]
pos=pos[match(rownames(exprSet),pos[,7]),c(7,2:4)]
table(pos[,2])
dim(pos)
dim(exprSet)

new_chr=gsub('chr','',pos[,2])
table(new_chr)
new_chr[new_chr=='X']=23
new_chr[new_chr=='Y']=24
new_chr=as.numeric(new_chr)
pos[,2]=new_chr
pos=pos[order(pos[,2],pos[,3]),]
write.table(pos,'scRNAseq_pos.txt',row.names = F,col.names = F,sep = '\t',quote = F)
write.table(exprSet,'scRNAseq_exprSet.txt',quote = F,sep = '\t')
Glioblastoma intra-tumor heterogeneity
Anoop P. Patel, Itay Tirosh, John J. Trombetta, Alex K. Shalek, Shawn M. Gillespie, Hiroaki Wakimoto, Daniel P. Cahill, Brian V. Nahed, William T. Curry, Robert L. Martuza, David N. Louis, Orit Rozenblatt-Rosen, Mario L. Suvà, Aviv Regev, and Bradley E. Bernstein Single-cell RNA-seq highlights intratumoral heterogeneity in primary glioblastoma Science. 2014 Jun 20; 344(6190): 1396–1401. doi: 10.1126/science.1254257
这篇文章是第一个提出单细胞转录组的CNV分析的,同样的代码制作input文件,同样的代码绘图
rm(list = ls())
a=read.table('~/data/scRNA_cnv/Glioblastoma_expressed_genes.txt',stringsAsFactors = F,header = T)
a[1:4,1:8]

exprSet=a[,-1]
rownames(exprSet)=a[,1]

pos = read.table('../airway/human.gene.positions')
head(pos)
exprSet=exprSet[rownames(exprSet) %in% pos[,7],]
pos=pos[match(rownames(exprSet),pos[,7]),c(7,2:4)]
table(pos[,2])
dim(pos)
dim(exprSet)
write.table(exprSet,'GBM_exprSet.txt',quote = F,sep = '\t')

new_chr=gsub('chr','',pos[,2])
table(new_chr)
new_chr[new_chr=='X']=23
new_chr[new_chr=='Y']=24
new_chr=as.numeric(new_chr)
pos[,2]=new_chr
pos=pos[order(pos[,2],pos[,3]),]
write.table(pos,'GBM_pos.txt',row.names = F,col.names = F,sep = '\t',quote = F)
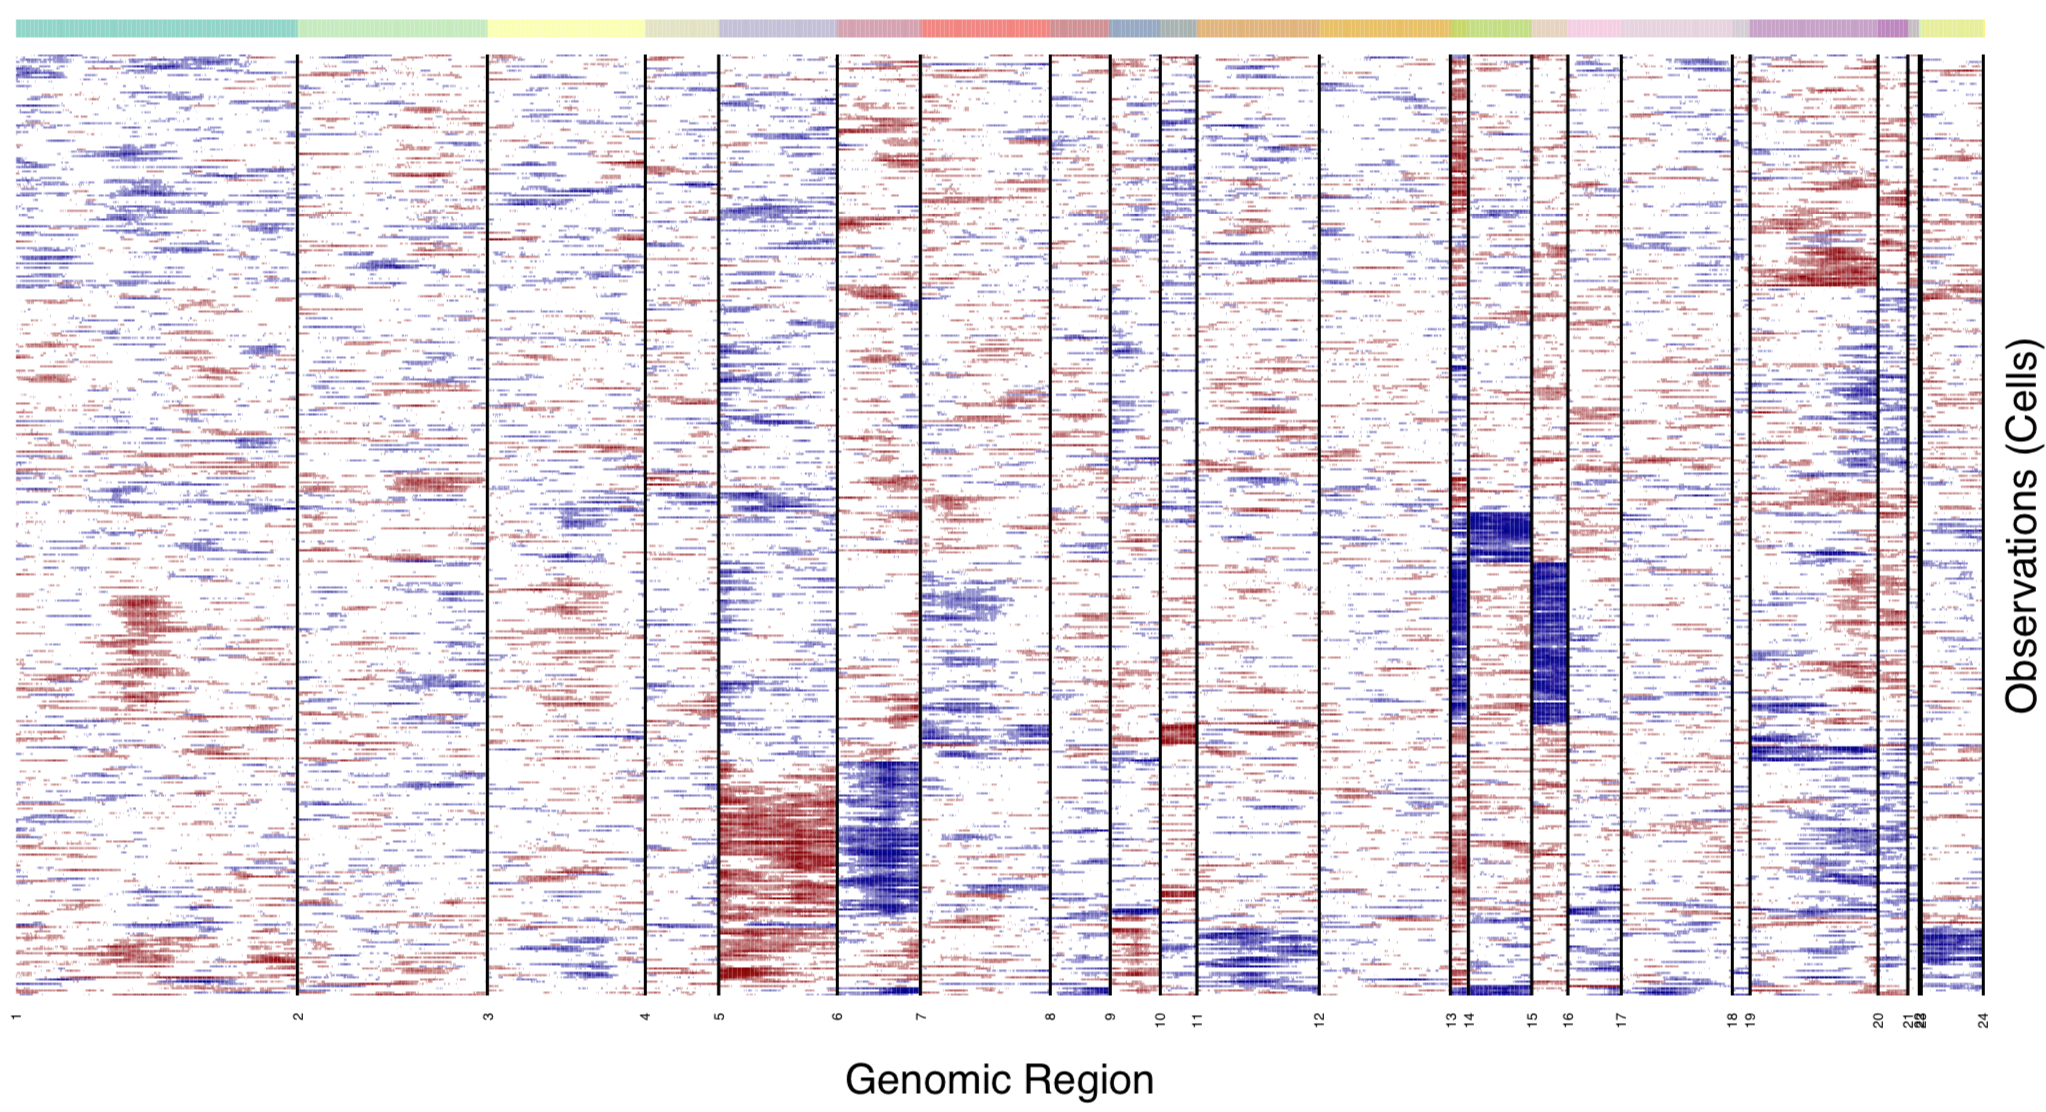
这个时候我的出图如下:
找到了发表该数据的文章里面的截图如下;
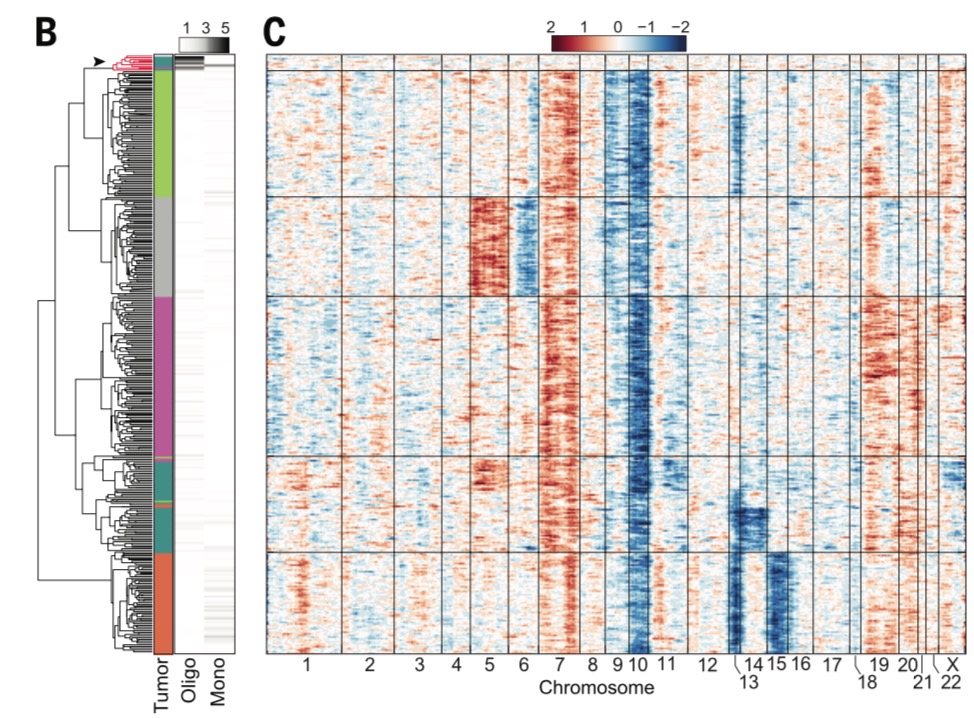
可以看到,pattern已经非常的类似了。
接下来要做的就是,不使用该软件,自己写代码完成这个分析。