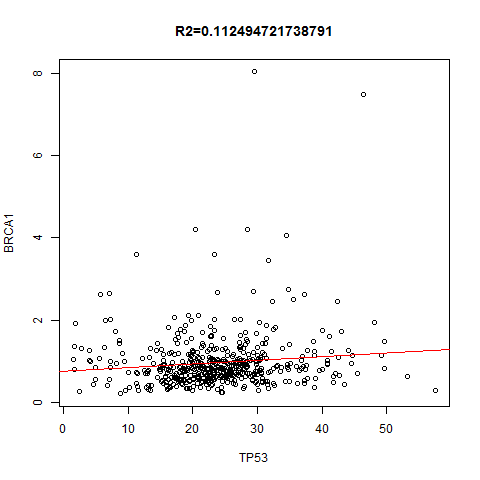
上面是指定一个基因在不同的癌种里面,本次讲指定任意两个基因,在所有癌种里面找到correlation并作图!图如下:
library(RMySQL)
con <- dbConnect(MySQL(), host="127.0.0.1", port=3306, user="root", password="11111111")
dbSendQuery(con, "USE gse62944")
dbListTables(con)
setwd('G:\\GSE62944') ## 这里不需要读本地文件,可以修改为读取数据库内容,因为我们第一讲说明了如何把它们全部load到数据库里面
tumorCancerType2amples=read.table('GSE62944_06_01_15_TCGA_24_CancerType_Samples.txt',sep = '\t',stringsAsFactors = F)
colnames(tumorCancerType2amples)=c('sampleID','CancerType')
## 不同的cancer type是分表存储,所以需要多次查询这两个基因的表达量
tmp=lapply(unique(tumorCancerType2amples$CancerType), function(x){
#x='PRAD'; ##可以先不要运行循环,先测试一个癌种
gene1="TP53";gene2="BRCA1";
sqlTable=paste('tumor',x,'RPKM',sep='_')
sqlQuery=paste0(' select * from ', sqlTable ,' where genesymbol = ',shQuote(gene1),' OR genesymbol = ',shQuote(gene2))
matrix2genes=dbGetQuery(con,sqlQuery)
rownames(matrix2genes)=matrix2genes$geneSymbol
matrix2genes=matrix2genes[,- match('geneSymbol',colnames(matrix2genes)) ]
matrix2genes=t(matrix2genes)
valueList1=as.numeric(matrix2genes[,gene1]);valueList2=as.numeric(matrix2genes[,gene2]);
png( paste0(gene1,'_and_',gene2,'_in_',x,'.SinalCor.png') )
plot(valueList1,valueList2,xlab=gene1,ylab=gene2)
abline(lm(valueList2~valueList1),col='red')
title(main =paste0("R2=",cor(valueList1,valueList2)))
dev.off()
return(c(x,fivenum(valueList1),fivenum(valueList2),cor(valueList1,valueList2)))
})## 这个循环会对每一个癌种种类,都画这两个基因的correlation图
write.csv(x = matrix(unlist(tmp),ncol=12,byrow = T),file = 'tumor.corration.csv')
如果是对正常样本查询,因我TCGA的正常样本不多,所以我存储在同一个表,不需要这样循环查询每一个癌种表格,所以拿到数据非常简单,代码大家可以试试看!