单细胞转录组数据分析可视化方法层出不穷,大家的创意都值得推荐,这里我们简单的分享针对《多个单细胞亚群各自差异分析后》的两个汇总可视化方法。
单次差异分析其实很容易可视化,火山图即可,大家都非常熟悉了。但是单细胞转录组数据分析首先就会降维聚类分群成为了很多个单细胞亚群,比如昨天我们分享的:使用单细胞技术发文章不要纠结于样品数量 就是总共就4个病人,8个单细胞样品,不到6万的细胞数量,29个群后归类成:
- ductal cells
- T cells
- natural killer (NK) cells
- B cells
- mast cells
- plasma cells
- endothelial cells
- fibroblasts
- myeloid cells
- acinar cells
- endocrine cells
- MKI67+ cycling ductal cells
而这些单细胞亚群,都是可以在三个分组:
- primary pancreatic tumors (PT)
- their respective paired hepatic metastases (HM),
- normal pancreatic tissue (NT)
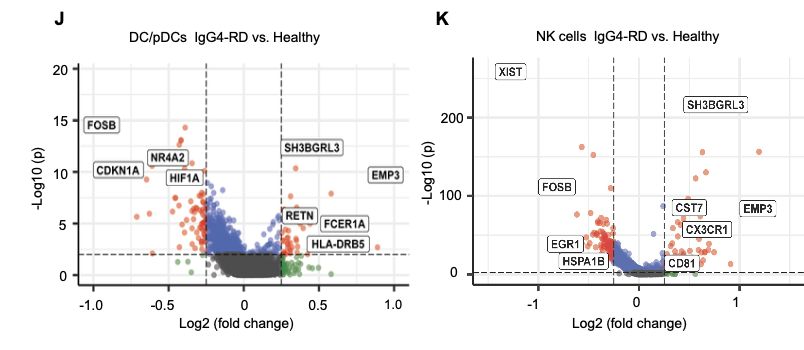
进行两两之间的差异分析,这样组合起来,就需要绘制起码上百个火山图了,有点浪费版面,虽然确实很多文章也是这样的在可视化,因为可以放文章的附件。比如文章《Single-cell transcriptome analysis and protein profiling reveal broad immune system activation in IgG4-related disease》,就是大量火山图的罗列,每个单细胞亚群在两分组差异分析后都需要一个火山图,很浪费版面空间:
批量差异分析(多个单细胞亚群)
我们这里是直接使用最简单的示范数据,来自于SeuratData包的ifnb数据集,代码如下所示:
library(SeuratData)
library(ifnb.SeuratData)
library(ReactomePA)
library(org.Hs.eg.db)
library(ggplot2)
data("ifnb")
table(ifnb$orig.ident)
sce = ifnb
sce$celltype=sce$seurat_annotations
Idents(sce)=sce$celltype
sce$group=sce$stim
gplots::balloonplot(table(sce$group,sce$celltype ))
Idents(sce) = sce$group
table(Idents(sce))
degs = lapply(unique(sce$celltype), function(x){
 FindMarkers(sce[,sce$celltype==x],ident.1 = 'STIM',
 ident.2 = 'CTRL')
})
x=degs[[1]]
do.call(rbind,lapply(degs, function(x){
 table(x$avg_log2FC > 1 )
}))
do.call(rbind,lapply(degs, function(x){
 table(x$avg_log2FC > -1 )
}))
这样就拿到了每个单细胞亚群在两分组的差异分析的上下调基因,以及基因对应的变化情况,可以去可视化:
首先是简单的热图
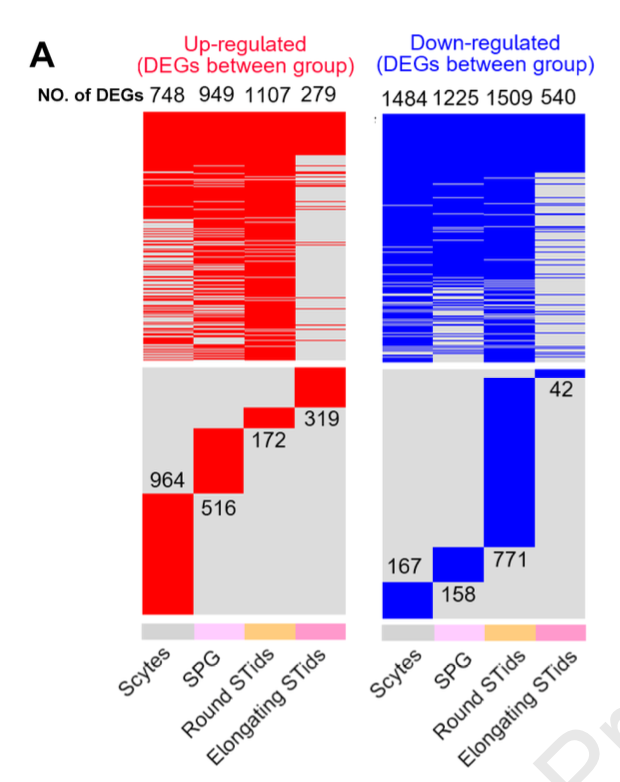
参加文章:《A single-cell landscape of triptolide-associated testicular toxicity in mice》,是2023的OMIX002591-小鼠睾丸药物处理前后单细胞差异分析
其次是
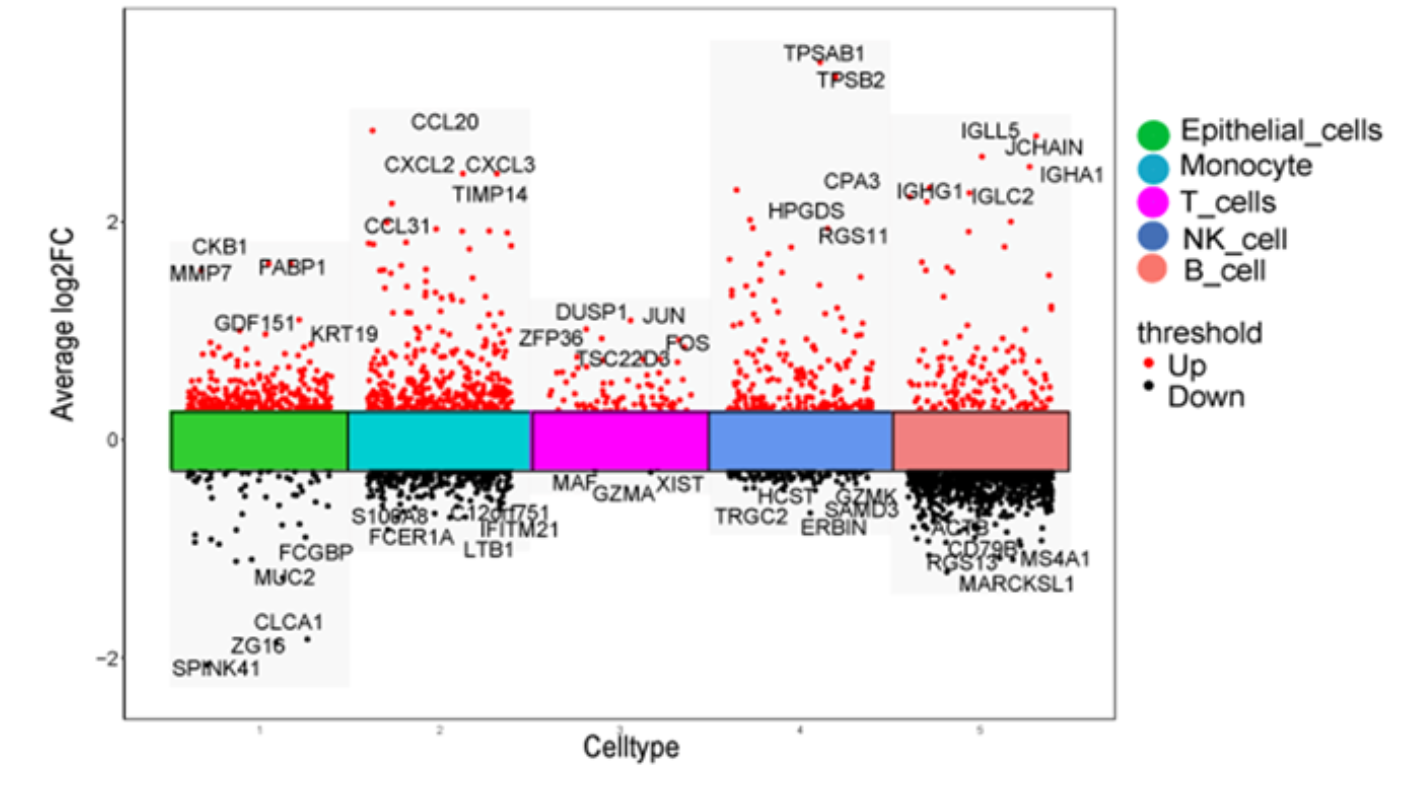
参考文献:《Integrated single‐cell and bulk RNA sequencing analysis identifies a prognostic signature related to ferroptosis dependence in colorectal cancer》,如下所示降维聚类分群后也是各个单细胞亚群在两个分组差异分析后的基因的logFC的可视化:
还有
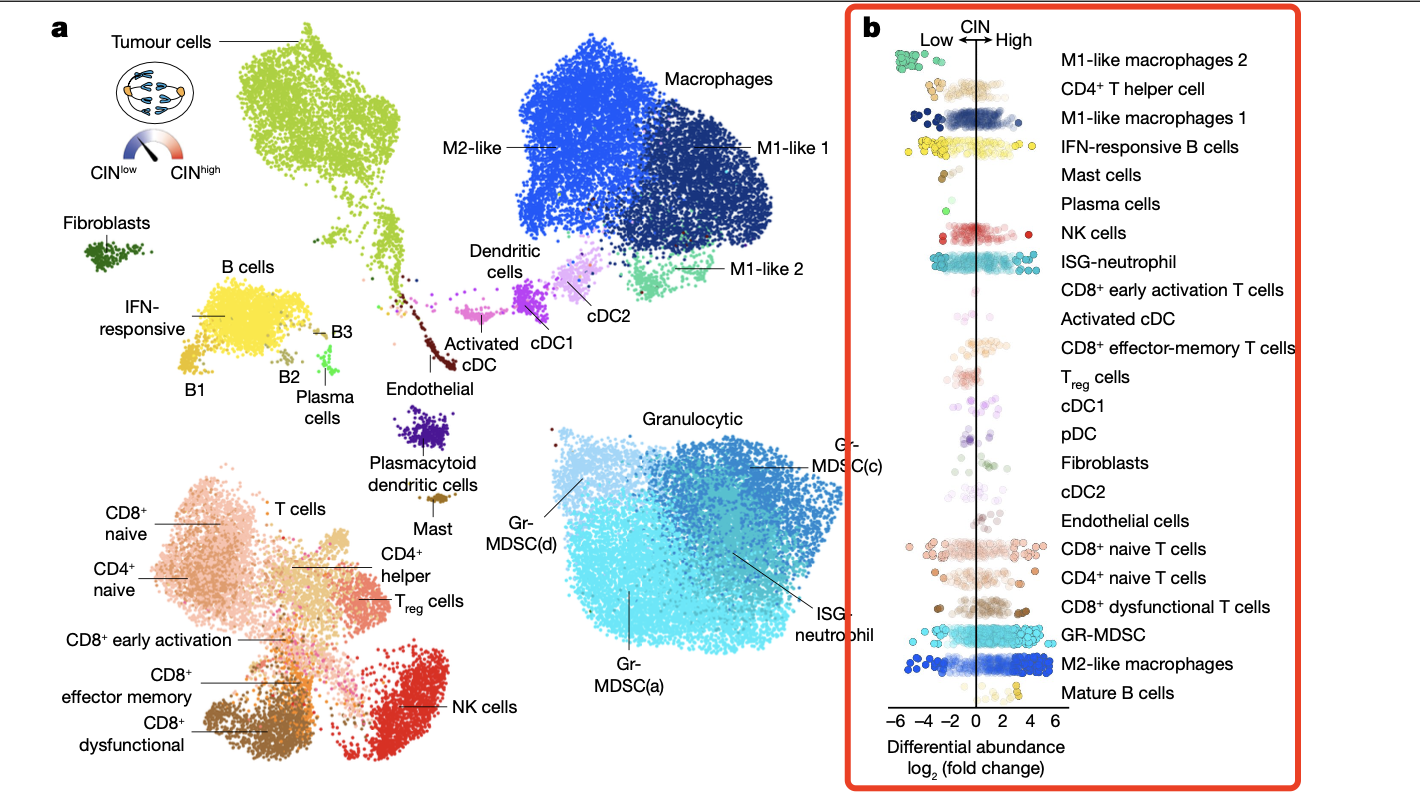
参考文献:《Non-cell-autonomous cancer progression from chromosomal instability》,如下所示降维聚类分群后也是各个单细胞亚群在两个分组差异分析后的基因的logFC的可视化 :
学徒作业
使用我给大家的代码,完成多个单细胞亚群在两分组的各自差异分析,然后尝试上面的3种汇总可视化方法。