聚类的基础就是算出所有元素两两间的距离,我们首先做一些示例数据,如下:
x=runif(10)
y=runif(10)
S=cbind(x,y) #得到2维的数组
rownames(S)=paste("Name",1:10,"") #赋予名称,便于识别分类
out.dist=dist(S,method="euclidean") #数值变距离
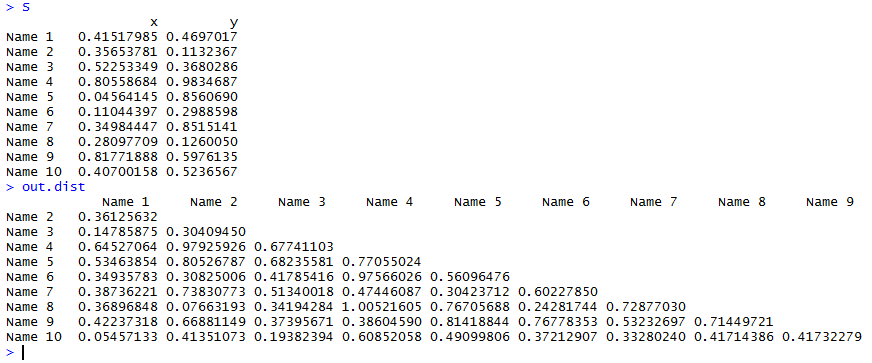
这个代码运行得到的S是一个矩阵,如下
> S
x y
Name 1 0.41517985 0.4697017
Name 2 0.35653781 0.1132367
Name 3 0.52253349 0.3680286
Name 4 0.80558684 0.9834687
Name 5 0.04564145 0.8560690
Name 6 0.11044397 0.2988598
Name 7 0.34984447 0.8515141
Name 8 0.28097709 0.1260050
Name 9 0.81771888 0.5976135
Name 10 0.40700158 0.5236567
可以看出里面共有10个点,它们的X,Y坐标均已知,我们有6总方法可以求矩阵
注释:在聚类中求两点的距离有:
1,绝对距离:manhattan
2,欧氏距离:euclidean 默认
3,闵科夫斯基距离:minkowski
4,切比雪夫距离:chebyshev
5,马氏距离:mahalanobis
6,蓝氏距离:canberra
用默认的算法求出距离如下
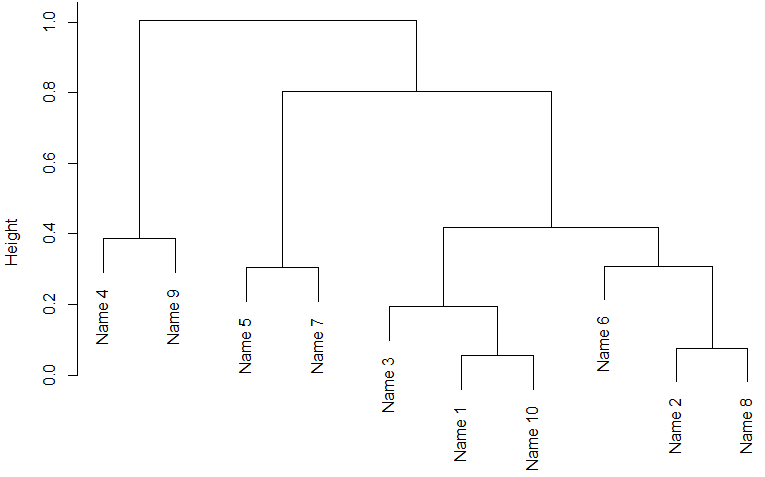
算出距离后就可以进行聚类啦!
out.hclust=hclust(out.dist,method="complete") #根据距离聚类
注释:聚类也有多种方法:
1,类平均法:average
2,重心法:centroid
3,中间距离法:median
4,最长距离法:complete 默认
5,最短距离法:single
6,离差平方和法:ward
7,密度估计法:density
接下来把聚类的结果图画出来
plclust(out.hclust) #对结果画图
rect.hclust(out.hclust,k=3) #用矩形画出分为3类的区域
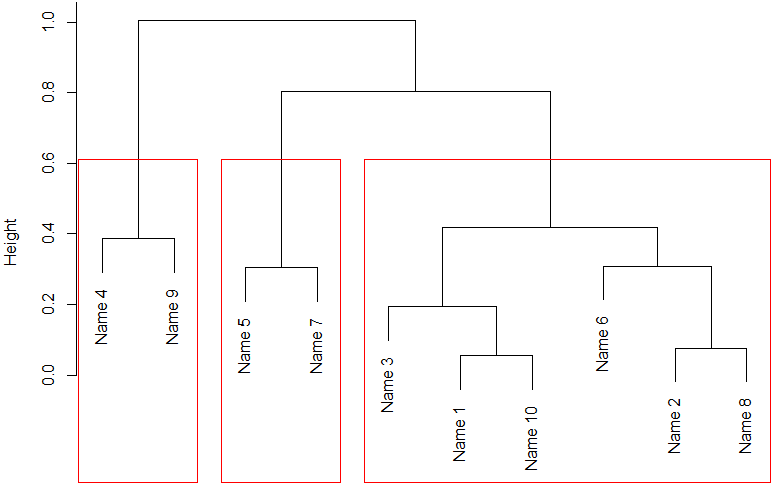
out.id=cutree(out.hclust,k=3) #得到分为3类的数值
这里的out.id就是把每个点都分类了的分类数组,1,2,3.