最近看到一个韩国人的TCGA数据挖掘文章,标题是:《Classification of Genes Based on Age-Related Differential Expression in Breast Cancer》,发表于2017年,研究者根据年龄对病人进行分组,使用TCGA数据库里面的乳腺癌患者数据,病人分成 3 组:
- Young patients were defined as ≤45 years of age
- elderly patients were defined as those ≥60 years of age
- The rest of the patients were defined as “intermediate.”
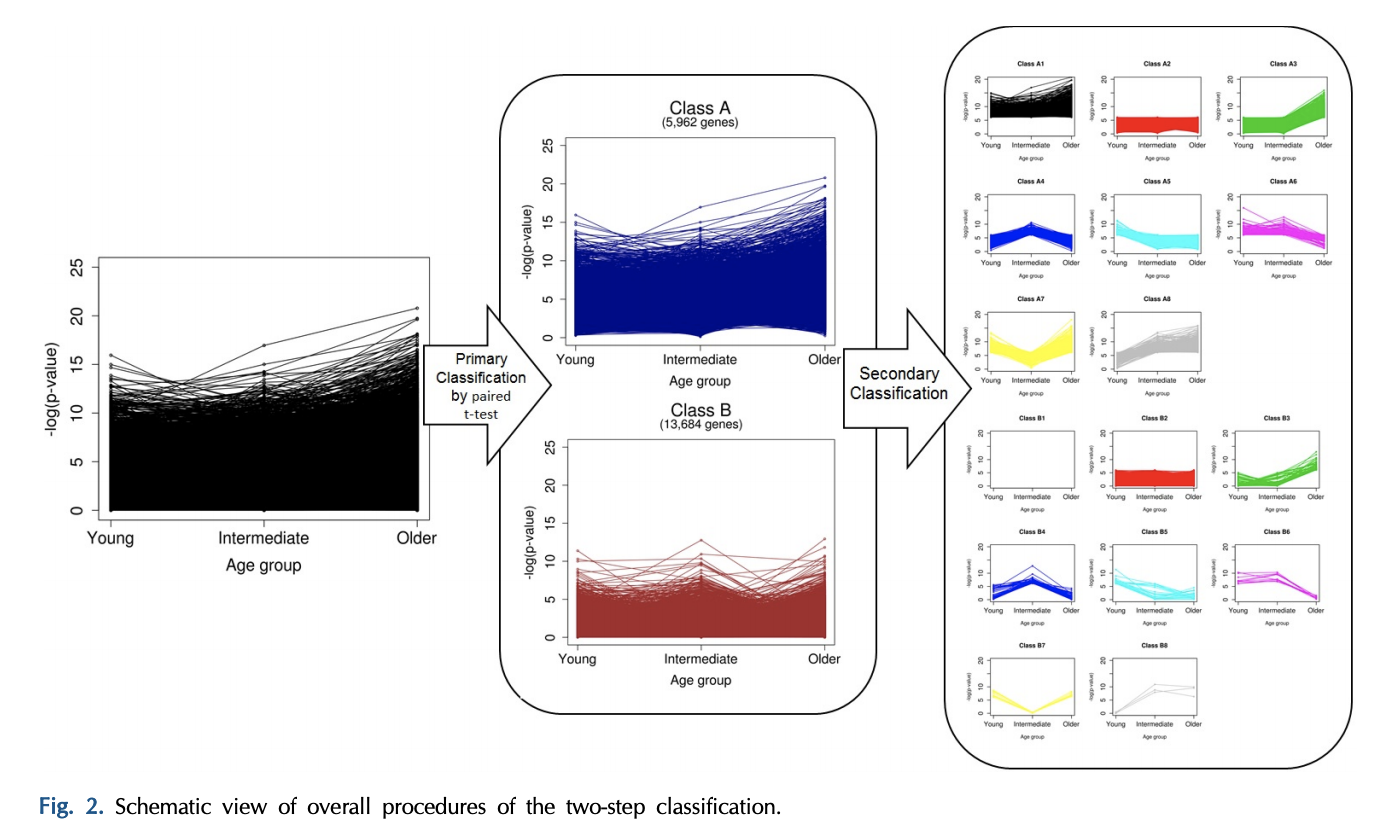
全部的分析流程如下所示:
- A total of 5,962 genes in class A were defined as significant DEGs in breast cancer, and 13,684 in class B were nonsignificant.
- Ones who want to find biomarkers or driver genes are likely to investigate only genes in class A.
- However, we classified the genes of each class once again into eight groups, based on the pattern of p-values, which were calculated separately for every age group (secondary classification in Fig. 2).
- After a second round of classification, the genes were eventually divided into 16 classes (A1–B8) (Supplementary Table 1).
差异分析把基因分成了两类,差异分析相信大家都不陌生了,基本上看我六年前的表达芯片的公共数据库挖掘系列推文即可;
- 解读GEO数据存放规律及下载,一文就够
- 解读SRA数据库规律一文就够
- 从GEO数据库下载得到表达矩阵 一文就够
- GSEA分析一文就够(单机版+R语言版)
- 根据分组信息做差异分析- 这个一文不够的
- 差异分析得到的结果注释一文就够
然后居然对基因的p值进行趋势分类,我勒个去,让人尴尬的脑阔疼!
作者的研究结果居然是把基因分成了16组,然后每个组有自己的生物学功能数据库注释结果,其中几个组可以把癌症样品和正常对照区分开来!
说他是灌水,都是侮辱了灌水这两个字!