于2019年1月发表在《Immunity》杂志的文章,标题是:《Single-Cell RNA Sequencing of Microglia throughout the Mouse Lifespan and in the Injured Brain Reveals Complex Cell-State Changes》
链接是:https://doi.org/10.1016/j.immuni.2018.11.004
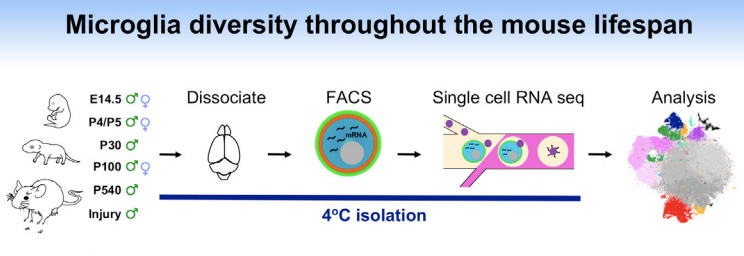
这个文章很有意思:Here, we analyzed the RNA expression patterns of more than 76,000 individual microglia in mice during development, in old age, and after brain injury.
也就是说,研究者在单细胞水平探究了小鼠生老病死的microglial细胞情况,挑选出来microglial细胞的策略是:Microglia were then FACS purified using the markers CD45, CD11b, and Cx3cr1 ,示意图如下所示:
以前粗糙的分类
Despite the morphological diversity present among microglia in development, health, injury, and disease, microglia have historically been characterized as “resting,” “M1” (proinflammatory), or “M2” (anti-inflammatory) based on simple in vitro stimulation methods.
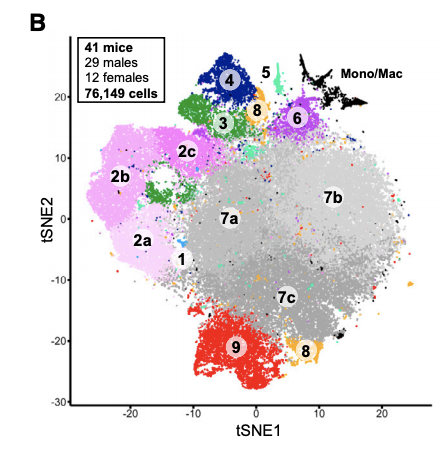
也就是说这个microglia在生老病死的各种情况下,其实形态上会有很大的变化,但是以前我们只能说区分处理 “resting,” “M1” , or “M2” 这3种,其实是远远不够的。所以研究者们做了单细胞转录组测序,拿到了76K个单细胞,对microglia 这个细胞群进行细分亚群。
数据在GEO
链接是:https://www.ncbi.nlm.nih.gov/geo/query/acc.cgi?acc=GSE121654
GSM3442006 E14.5 female no 1
GSM3442007 E14.5 male no 1
GSM3442008 E14.5 female no 2
GSM3442009 E14.5 female no 3
GSM3442010 E14.5 male no 2
GSM3442011 E14.5 female no 4
GSM3442012 E14.5 male no 3
GSM3442013 E14.5 male no 4
.....
第一次降维聚类分群:
这个76,000细胞数量在2019年初可能还行,现在基本上10个10x样品就OK了。
上游分析仍然是传统的10x仪器御用cellranger流程
Sequenced samples were processed using the Cell Ranger 1.2 pipeline and aligned to the GRCm38 (mm10) mouse reference genome. For each sample a digital gene expression matrix (DGE) was generated containing the raw UMI counts for each cell in a given sample.
现在cellranger流程已经进化到V6了,我们也是在单细胞天地公众号详细介绍了cellranger全部使用细节及流程,大家可以自行前往学习,如下:
- 单细胞实战(一)数据下载
- 单细胞实战(二) cell ranger使用前注意事项
- 单细胞实战(三) Cell Ranger使用初探
- 单细胞实战(四) Cell Ranger流程概览
- 单细胞实战(五) 理解cellranger count的结果
但是这个3年前的系列笔记是基于V2,V3版本的cellranger,在2020的7月我看到了其更新到了V4,也里面写了一个总结,见:cellranger更新到4啦(全新使用教程),后面的V5,V6我基本上都是马上就更新教程,不过这些教程其实大同小异啦,还是推荐大家直接看官网文档。
下游分析
起初文章自己的数据整合并没有使用seurat,而是 independent component analysis (ICA) based platform, as described in (Saunders et al., 2018),但是后来它结合了公共数据的时候,又使用了CCA算法。见:To perform a more direct comparison between the pathological microglia (DAM and IRM), we used canonical correlation analysis (CCA) (Butler et al., 2018) to account for differences between the single-cell platforms (10x Genomics versus Marsseq).
其实这样的单细胞转录组测序整合算法超级多,我想你应该是不会一一细看的,我就列出来而已:
- MNNcorrect (https://doi.org/10.1038/nbt.4091)
- CCA + anchors (Seurat v3) (https://doi.org/10.1101/460147)
- CCA + dynamic time warping (Seurat v2) (https://doi.org/10.1038/nbt.4096)
- LIGER (https://doi.org/10.1101/459891)
- Harmony (https://doi.org/10.1101/461954)
- Conos(https://doi.org/10.1101/460246)
- Scanorama(https://doi.org/10.1101/371179)
- scMerge(https://doi.org/10.1073/pnas.1820006116)
大家看到最多的其实是CCA + anchors (Seurat v3),这也是我的教程里面经常出现的。参考前面的例子:人人都能学会的单细胞聚类分群注释 ,多个单细胞对象的整合,这里直接使用标准CCA + anchors (Seurat v3)代码即可:
pro='integrated'
for (i in 1:length(sceList)) {
 sceList[[i]] <- NormalizeData(sceList[[i]], verbose = FALSE)
 sceList[[i]] <- FindVariableFeatures(sceList[[i]], selection.method = "vst",
 nfeatures = 2000, verbose = FALSE)
}
sceList
sce.anchors <- FindIntegrationAnchors(object.list = sceList, dims = 1:30)
sce.integrated <- IntegrateData(anchorset = sce.anchors, dims = 1:30)
感兴趣的可以下载数据, 走一下:人人都能学会的单细胞聚类分群注释 ,看看能不能得到文章里面类似的亚群。