文章提到其单细胞转录组数据是:We used scRNA-seq to profile 49 samples (45 lung adenocarcinomas, 1 squamous cell carcinoma, and 3 tumor adjacent tissues [TATs]) (Figure 1A), corresponding to 30 individual patients.
我们可以使用下面的代码检查临床属性:
rm(list=ls())
options(stringsAsFactors = F)
library(Seurat)
library(ggplot2)

### 来源于 step2-anno-first.R
load(file = 'phe-of-first-anno.Rdata')
dim(phe)

## 来源于: CNS图表复现05—免疫细胞亚群再分类
load(file = 'phe-of-subtypes-Immune-by-manual.Rdata')
dim(phe)

ps=as.data.frame(table(phe$patient_id,phe$sample_name))
ps=ps[ps$Freq>1,]
ps
tail(sort(table(ps$Var1)))

# TH266 TH103 TH158 TH179 TH185 TH226
# 2 3 3 3 3 3
可以看到其中有两个病人 TH226 and TH266, 是进行了多时间点采样,其中TH226有3个样品,而病人 TH226是2个样品。
文章是 residual disease (RD) 和 on therapy progressive disease (PD),以及 patients before initiating systemic targeted therapy (TKI naive [TN]), 这3组。
这两个病人的各自的多个样品的单细胞数量分布如下:
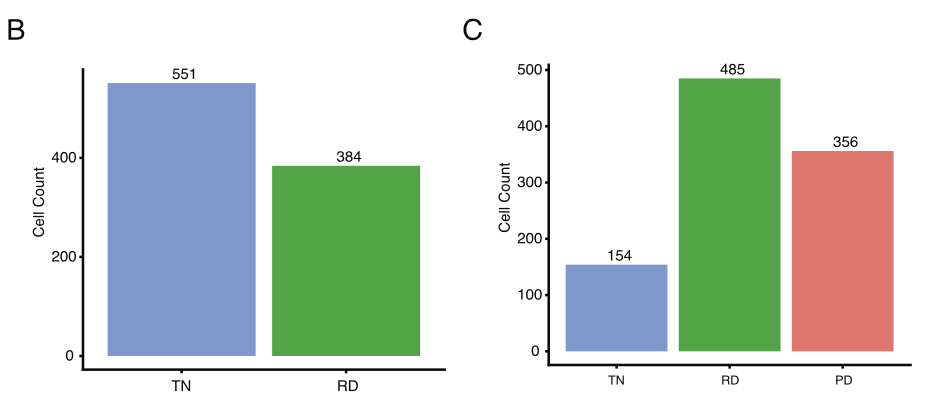
这就是一个简单的ggplot的条形图罢了,就不展示绘图细节,获取数据也很简单,代码如下:
> ps[ps$Var1=='TH226',]
 Var1 Var2 Freq
1253 TH226 LT_S52 156
1433 TH226 LT_S57 485
1973 TH226 LT_S82 566
> ps[ps$Var1=='TH266',]
 Var1 Var2 Freq
1800 TH266 LT_S75 592
1944 TH266 LT_S81 447
可以看到, 跟原文仍然是有数量差异,但是不同分组的数量相对高低 是没有变化的。
文章显示的细胞亚群比例变化如下:
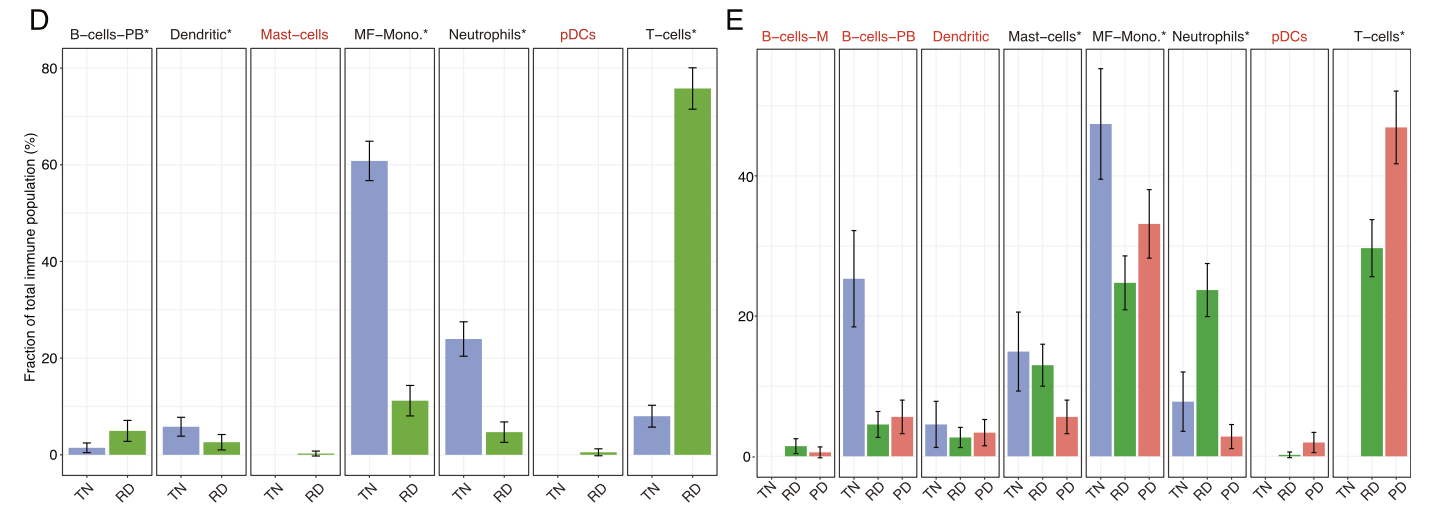
原文描述是,RD组比TN来说,两个病人都是巨噬细胞降低而T细胞上升 :
- In 2 tumor biopsies available for patient TH266, both macrophages and T cells showed reduction in the fraction of macrophages and an increase in the fraction of T cells from TN to RD, findings which match the entire cohort
- TH226 exhibited a similar pattern with the fraction of macrophages decreasing at RD after initiation of treatment and increasing again at PD
同样的,我们自己写代码,完成上面的分析,如下;
TH266_phe=phe[phe$patient_id=='TH266',]
library(gplots)
tab.1=table(TH266_phe$analysis,TH266_phe$immuSub)
balloonplot(tab.1)

TH226_phe=phe[phe$patient_id=='TH226',]
library(gplots)
tab.1=table(TH226_phe$analysis,TH226_phe$immuSub)
balloonplot(tab.1)
出图如下:
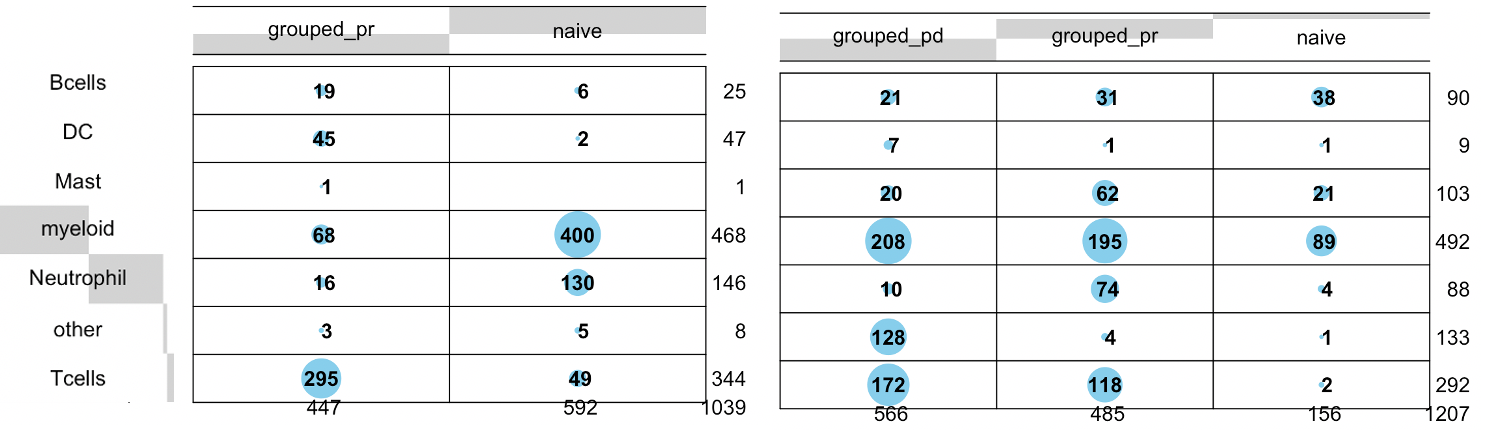
文章是 residual disease (RD) 和 on therapy progressive disease (PD),以及 patients before initiating systemic targeted therapy (TKI naive [TN]), 这3组。前面提到的RD组比TN来说,两个病人都是巨噬细胞降低而T细胞上升。
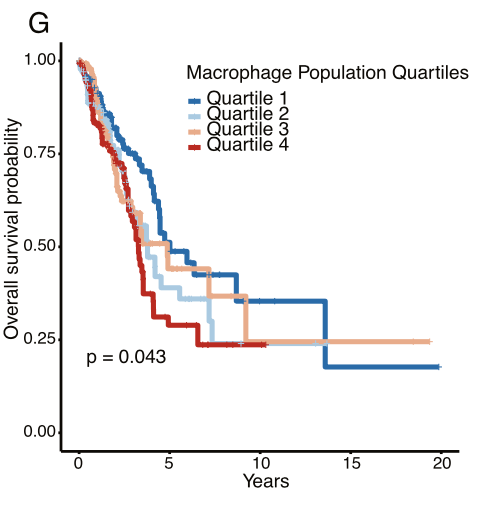
macrophages的临床意义
既然我们得到了结论,residual disease (RD)相比较naive肿瘤样品来说,都是 巨噬细胞降低而T细胞上升。就需要证明这个发现的临床意义。
(G) Kaplan-Meier plot of deconvoluted TCGA lung adenocarcinoma data showing the relation between OS and the fraction of macrophages for each patient. Patients were stratified by high and low macrophage fraction.
作为一个学徒作业吧!
可以直接下载到TCGA数据库的 lung adenocarcinoma队列的临床信息,以及那些病人的免疫细胞比例,可以自己根据四分位数来做上面的生存分析!
其实文章也提供了他们使用的TCGA数据库,如果你也想加入交流群,自己去:你要的rmarkdown文献图表复现全套代码来了(单细胞)找到我们的拉群小助手哈。
往期教程目录:
- CNS图表复现01—读入csv文件的表达矩阵构建Seurat对象
- CNS图表复现02—Seurat标准流程之聚类分群
- CNS图表复现03—单细胞区分免疫细胞和肿瘤细胞
- CNS图表复现04—单细胞聚类分群的resolution参数问题
- CNS图表复现05—免疫细胞亚群再分类
- CNS图表复现06—根据CellMarker网站进行人工校验免疫细胞亚群
- CNS图表复现07—原来这篇文章有两个单细胞表达矩阵
- CNS图表复现08—肿瘤单细胞数据第一次分群通用规则
- CNS图表复现09—上皮细胞可以区分为恶性与否
- CNS图表复现10—表达矩阵是如何得到的
- CNS图表复现11—RNA-seq数据可不只是表达量矩阵结果
- CNS图表复现12—检查原文的细胞亚群的标记基因
- CNS图表复现13—使用inferCNV来区分肿瘤细胞的恶性与否
- CNS图表复现14—检查文献的inferCNV流程
- CNS图表复现15—inferCNV流程输入数据差异大揭秘
- CNS图表复现16—inferCNV结果解读及利用
- CNS图表复现17—inferCNV结果解读及利用之进阶