看到华大基因团队的课题组丢在GigaScience杂志的一篇文章:Single-cell transcriptomic landscape of nucleated cells in umbilical cord blood ,链接是:https://academic.oup.com/gigascience/article/8/5/giz047/5484799 ,该研究仅仅是2个志愿者的脐带血单细胞转录组而已,但是成功的跟10X官网的外周血单细胞转录组细胞分群进行对比描述,讲述了一个比较好的生物学故事!
- To acquire a transcriptomic map of UCB cells at single-cell resolution, we collected samples of UCB from 2 healthy donors and isolated nucleated cells for single-cell RNA-seq using the 10 × Chromium platform.
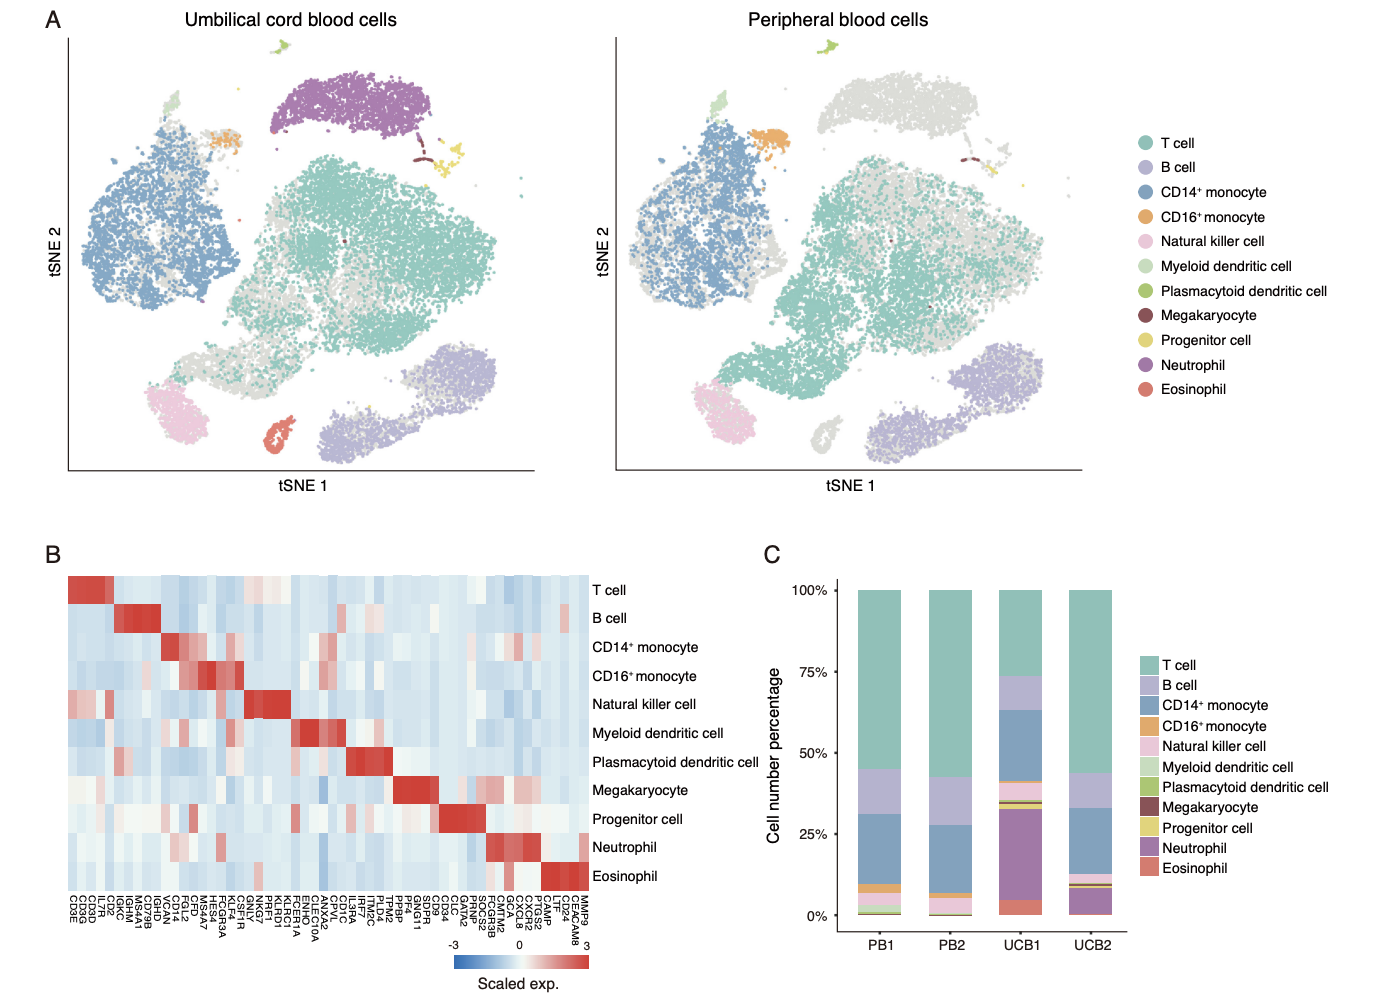
- After stringent quality control and filtering by multiple criteria (see Methods), transcriptomes of 7,852 and 9,785 single cells from the 2 UCB samples (UCB1 and UCB2) were acquired, detecting a mean of 1,270 and 1,460 genes per cell, respectively.
上面是单细胞转录组数据量的描述,是10X仪器的单细胞转录组数据,并没有看到表达矩阵上传到GEO数据库,但是在NCBI和EBI可以下载原始的fastq数据文件,ID是 PRJNA524398 。
To determine the unique cell subpopulations and the specific state of gene expression in UCB, we used the public single-cell transcriptomics dataset of PB cells for comparison. This dataset includes 2 independently generated libraries (PB1 and PB2), containing a total of 11,948 single-cell profiles of peripheral blood mononuclear cells (PBMCs) measuring 1,069 genes per cell on average. These are at a comparable level with those of the UCB data.
两个数据集的比较如下:
公共数据来源10X官网: https://support.10xgenomics.com/single-cell-gene-expression/datasets
Public single-cell gene expression datasets of PBMCs (PB1 and PB2) were generated from a sample from a single donor. In the present study, PB1 and PB2 correspond to Cell Ranger 2.0.1-processed “8k PBMCs from a healthy donor” and “4k PBMCs from a healthy donor,” respectively。
自有数据采用BGISEQ-500 sequencer,看起来这个文章是为了支撑他们的测序仪的准确性吧。
Purified DNA nanoballs were sequenced using the BGISEQ-500 sequencer, generating reads containing 16 base pairs of 10x™ barcodes, 10 base pairs of UMIs, and 100 base pairs of 3′ complementary DNA sequences. Each library was sequenced in 3 lanes, yielding ∼1.9 billion reads in total
数据上传到了两个地方: - The raw data reported in this study are deposited in the NCBI Sequence Read Archive under bioproject No. PRJNA524398
- and in the CNGB Nucleotide Sequence Archive (CNSA) (CNSA: https://db.cngb.org/cnsa/) with accession No. CNP0000090.
其中作者测试了3个方法矫正技术误差,To minimize any technical variance that could lead to misinterpretation of the data, we rigorously tested 3 widely used algorithms for batch effect correction, namely, CCA, SVA, and MNN. Based on a quantitative evaluation of cell segregation in the tSNE space, MNN and CCA appeared comparable and effective for our datasets, although MNN scored marginally higher.
文章的描述如下:
To isolate biological variance from the interfering technical variances in the remaining data, we employed 3 independent computational methods, canonical correlation analysis (CCA) [19], surrogate variable analysis (SVA) [20], and mutual nearest neighbors (MNN) [21], to systemically correct the potential technical variance (Supplementary Fig. S2A–D).
最后选择了 mutual nearest neighbors (MNN) 方法,而不是我们一直推荐的CCA:
Results indicated that the MNN algorithm most successfully eliminated the batch effect in the current dataset (Supplementary Fig. S2E and F). Thus, we proceeded to use MNN-corrected expression matrices for the Seurat pipeline and all subsequent analysis.假如你的10X样品数据量也不够
试试看自己领域的公共数据库,虽然算不上多如牛毛,但基本上十几个公共数据集还是可以找到的,比较10X走入了寻常百姓家!