本次分享的文章发表在 Nat Med. 2018 Aug; 题目是:Phenotype molding of stromal cells in the lung tumor microenvironment. 共选取5例病人的共19个样本,通过10×genomics单细胞转录组测序探索基质细胞的亚群分类、基因功能(信号通路)、关键marker基因和临床预后。共鉴定出52个基质细胞亚群,反映了肿瘤微环境复杂性。对基质细胞的marker基因做生存曲线,发现这些marker基因可以作为肺癌预后诊断的潜在标志物。 为科学家们提供一种研究细胞类型的基准,便于后期研究人员在体外或动物模型中对这些细胞类型进行深度研究。同时,这些基质细胞亚型的生物标记作用,对患者的治疗与预后评估也至关重要。
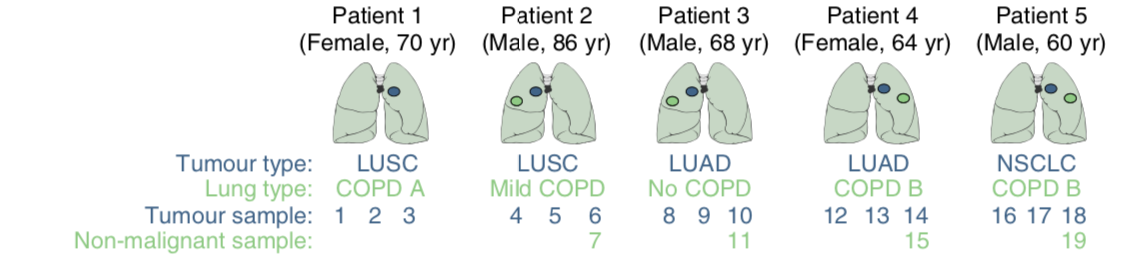
总共是5个病人
如下所示,5个肺癌患者共取样19个进行10x测序,包括tumor or non-malignant lung细胞。
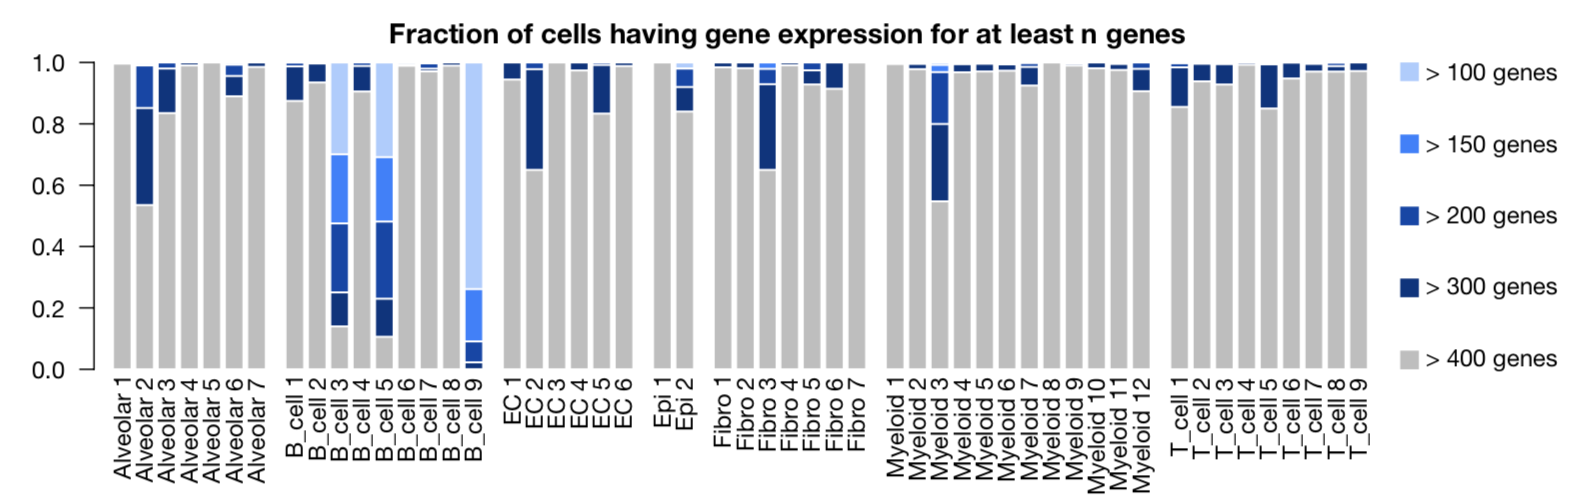
检测到的基因数量都很少,因为平均每个细胞就4000条UMI,测序数据在:E-MTAB-6149 and E-MTAB-6653.
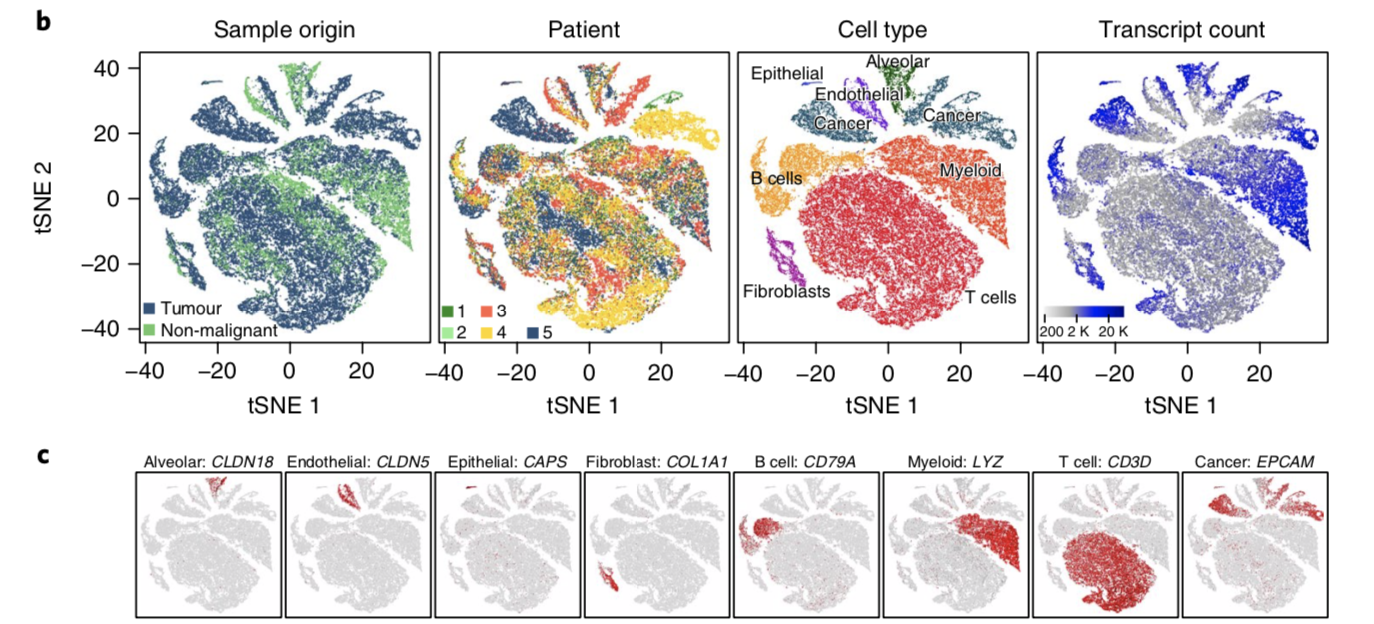
八大类细胞群
总共是52,698 cells,总共是200M的reads,每个细胞至少检测到100个基因,使用前8个主成分进行聚类,初步分为8类细胞:
- immune cells(myeloid, T and B cells),
- fibroblasts,
- endothelial cells,
- alveolar cells
- epithelial cells
- cancer cell
每一群细胞都有自己独特的marker基因表达,可以热图可视化。
八大类细胞细分为52+12个亚群
其中52 stromal cell subclusters and the 12 cancer cell subclusters (left to right)
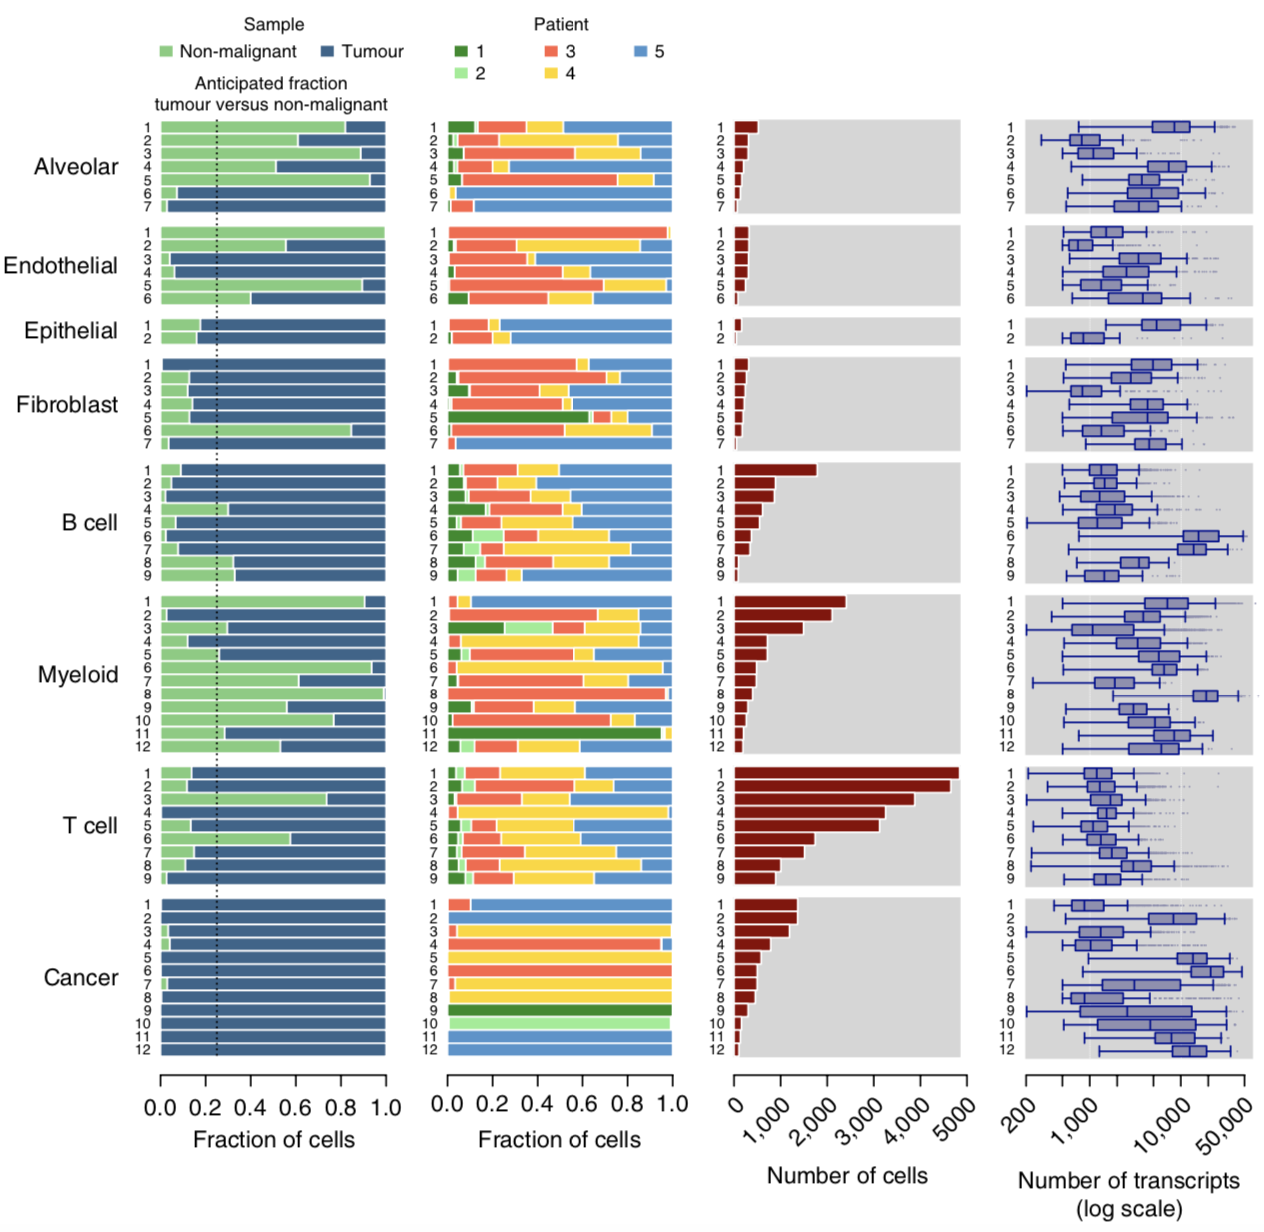
1,592 endothelial cells可以划分为6 clusters
同样的,对每群细胞可以寻找marker基因,功能注释,已经各个marker基因在TCGA数据库的表达量差异情况。
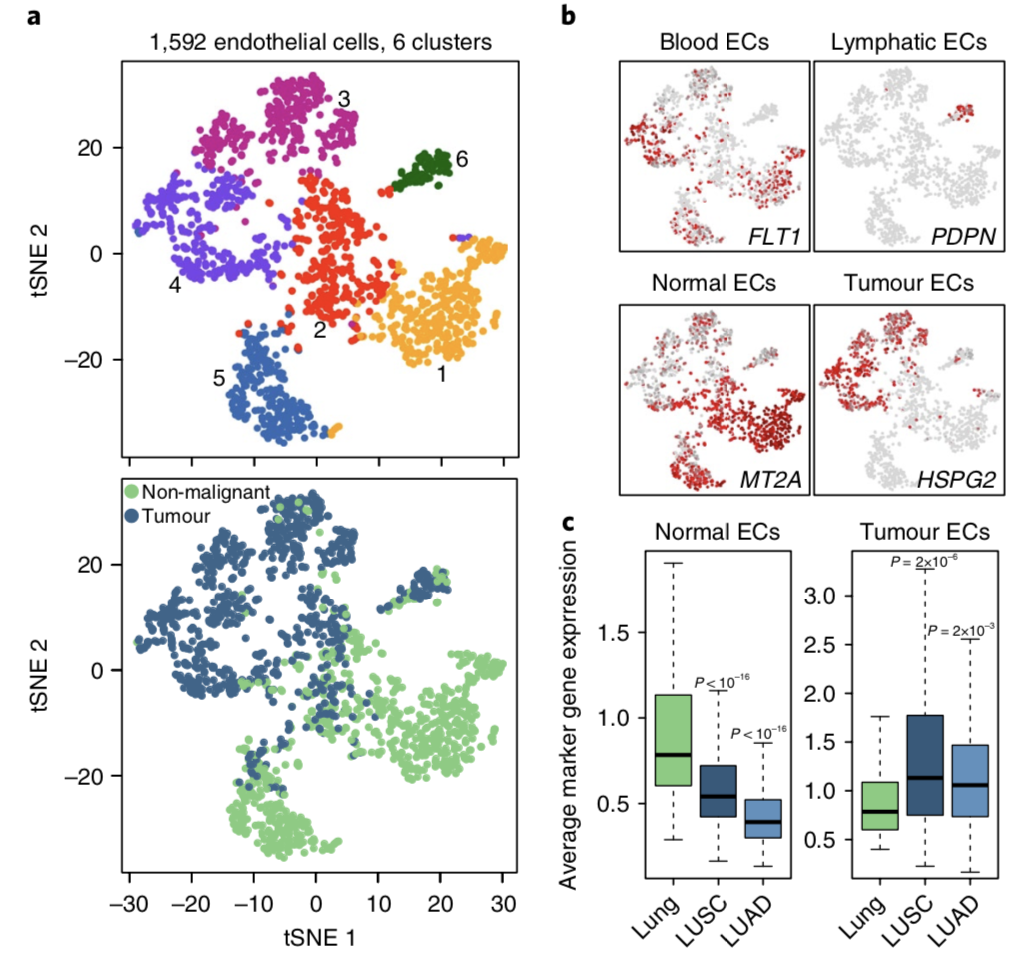
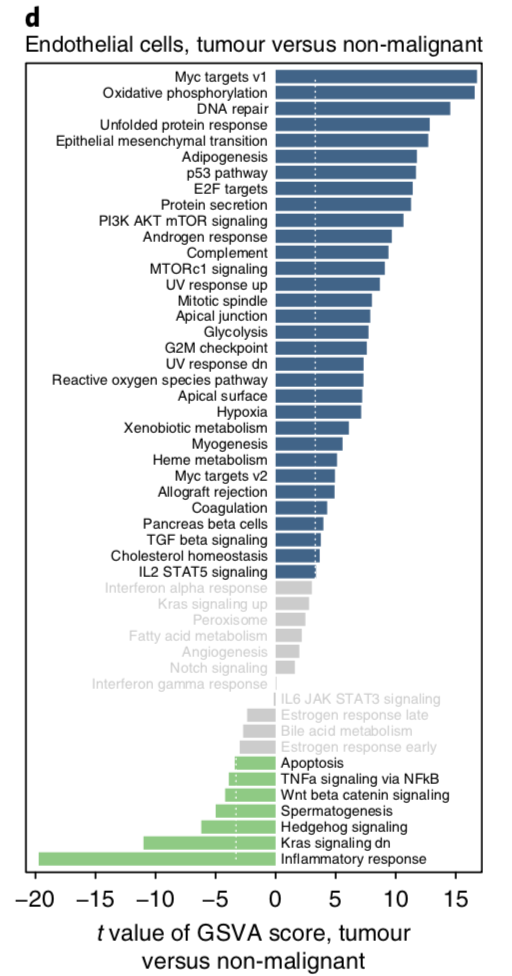
既然可以区分为恶性与否,就可以进行差异分析,GO/KEGG数据库注释,GSEA,GSVA分析,功能注释Differences in pathway activities scored per cell by GSVA between tumor and normal endothelial cell (n = 618 and 569 cells from 5 patients, respectively).
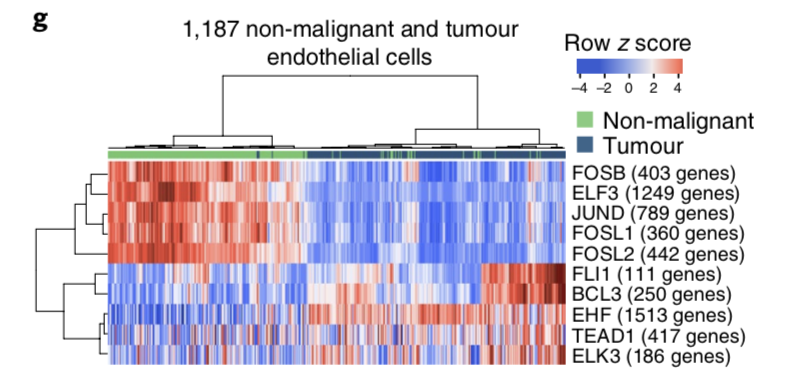
还可以使用scenic来推测转录调控,SCENIC: single-cell regulatory network inference and clustering
Heatmap of the area under the curve (AUC) scores of expression regulation by transcription factors, as estimated using SCENIC, for each of the 1,187 endothelial cells from clusters 1, 3, 4 and 5.
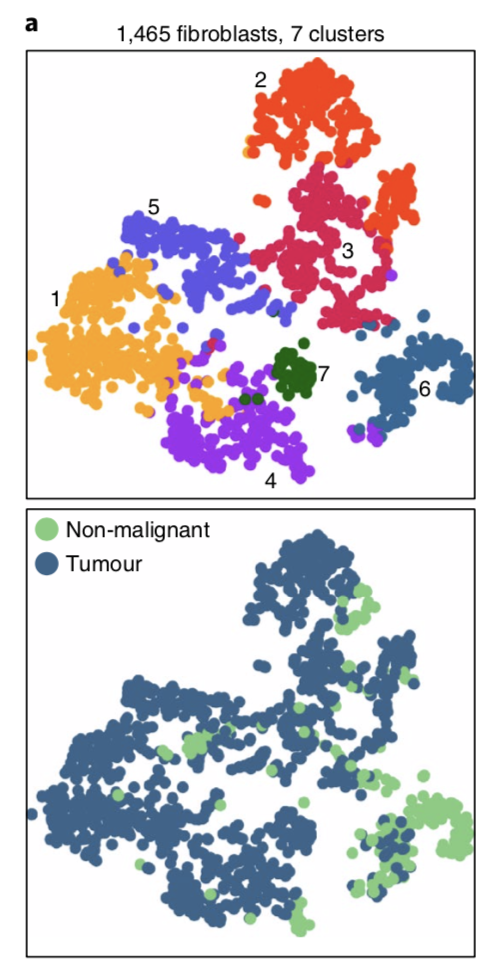
1,465 fibroblasts 可以划分为 7 clusters
与 endothelial细胞同样的分析,分群如下;
其它非癌症细胞也是同样的分析策略: - 5,603 B cells and myeloid cells, 9 clusters
- 9,756 myeloid cells, 12 clusters
- 24,911 T cells, 9 clusters
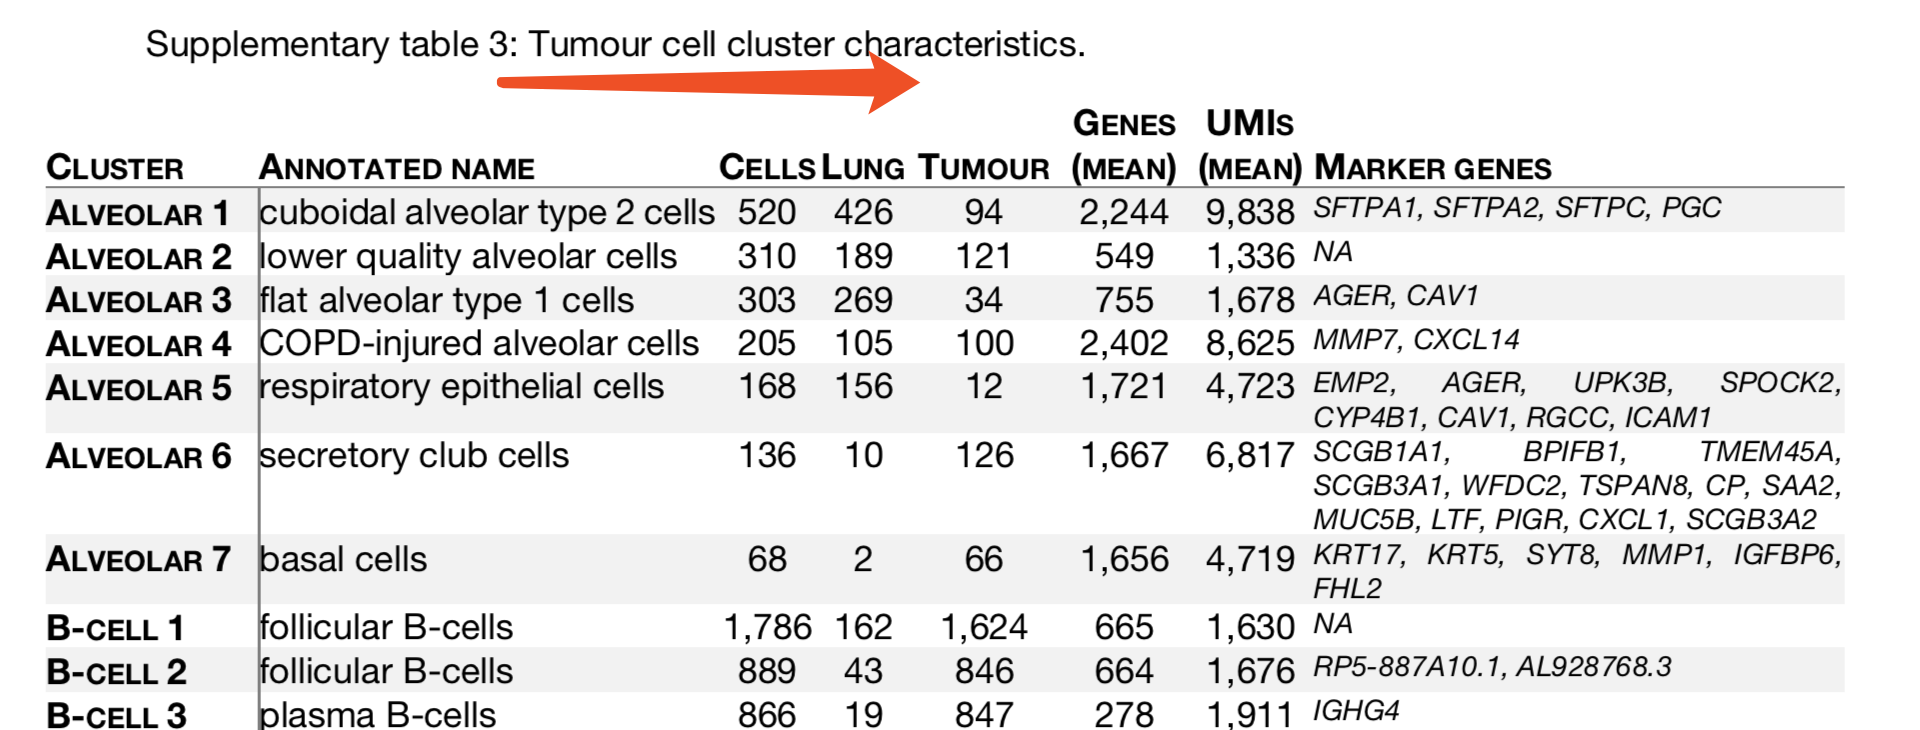
- 1,710 alveolar cells, 7 clusters (附件展现)
每个大群细胞如何细分为小群细胞,详情见附件:
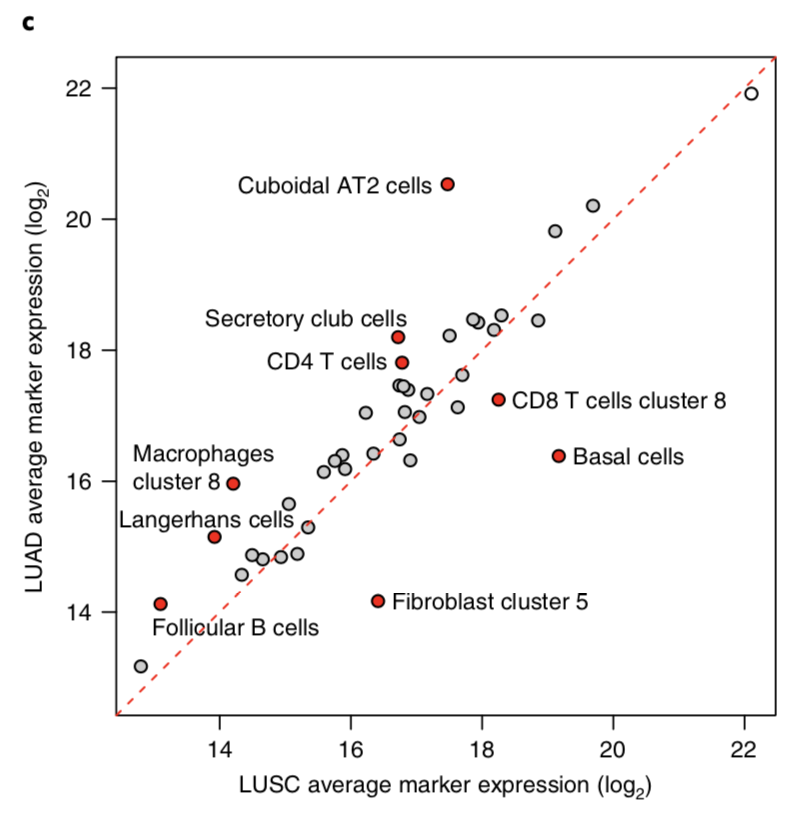
TCGA数据库的LUSC和LUAD的差异
这里检验了42种细胞的marker基因,但是只要9种是LUSC和LUAD里面表现差异显著,其中2个之所以差异,是因为LUAD deriving from AT2 cells and LUSC from basal cells
Average expression of marker genes in LUAD (n = 501) or LUSC (n = 513) samples, characterized using RNA-seq in TCGA. Stromal cell types showing >2-fold change in expression between both cancer types are named and highlighted
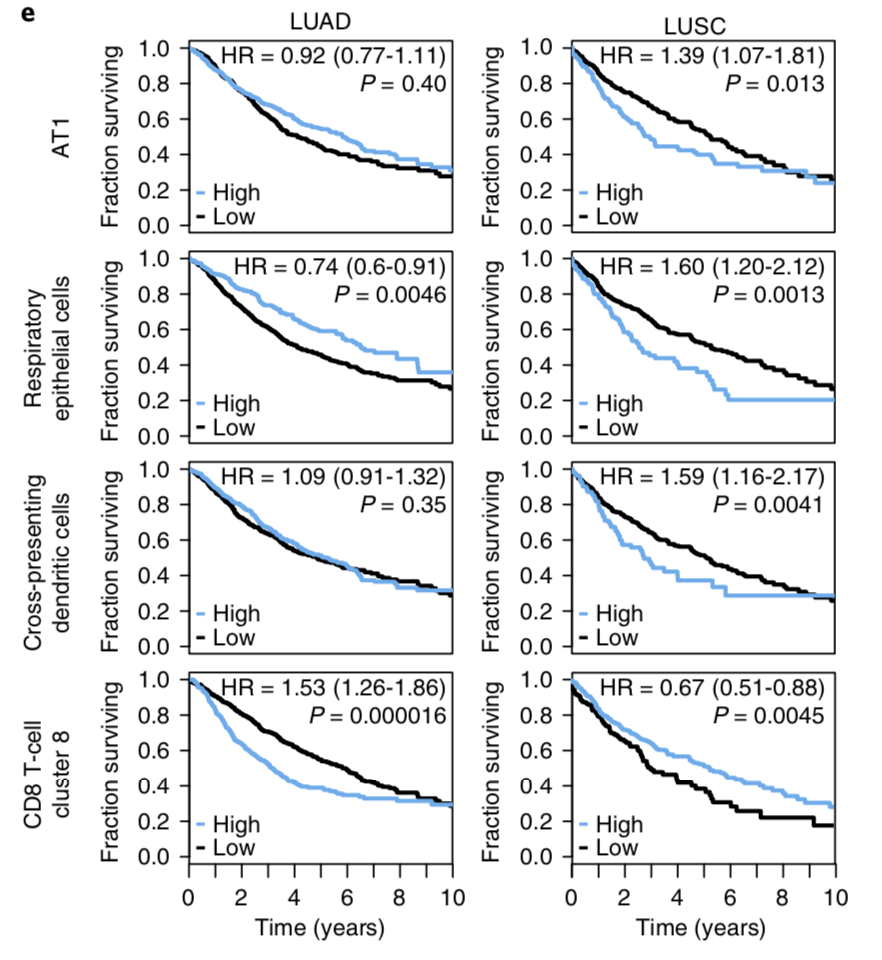
不同群细胞的生存分析
这里使用LUAD or LUSC (n = 1,027 or 545 patients, respectively)来验证本文单细胞分群结果的临床意义。
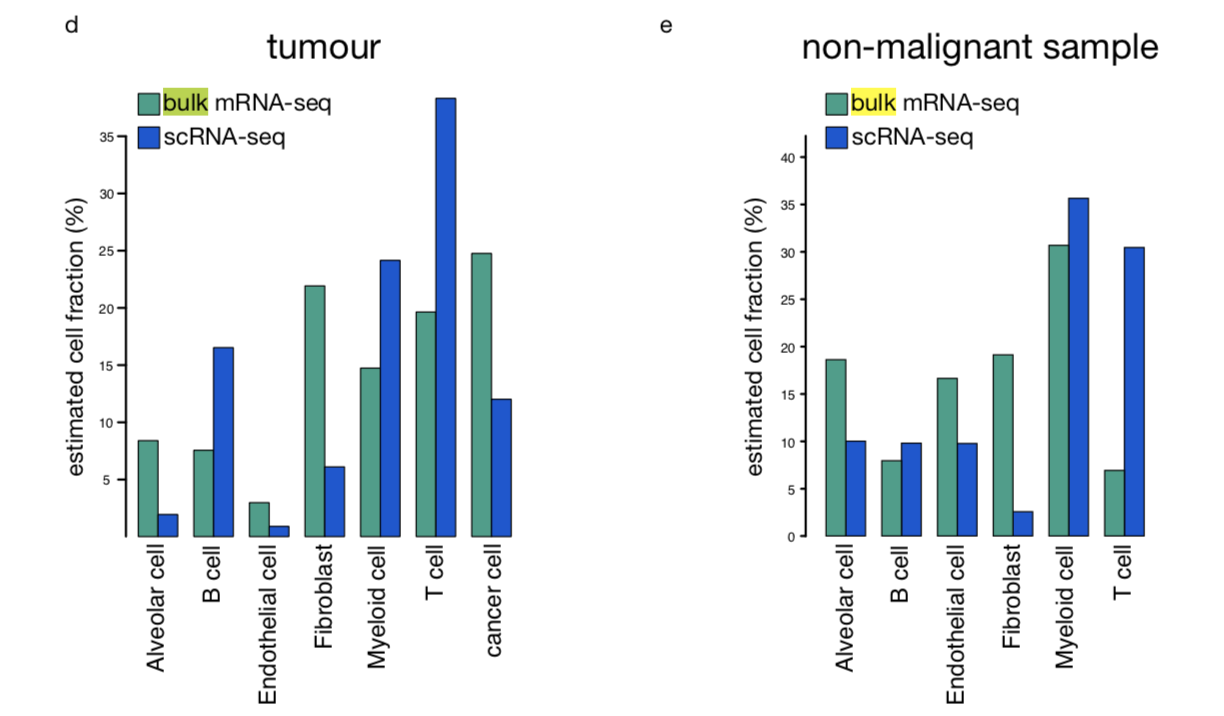
bulk转录组测序和单细胞
研究者选取了a tumor sample adjacent to sample 1 and a non-malignant lung sample adjacent
to sample 19. 这样就可以跟单细胞转录组进行比较。
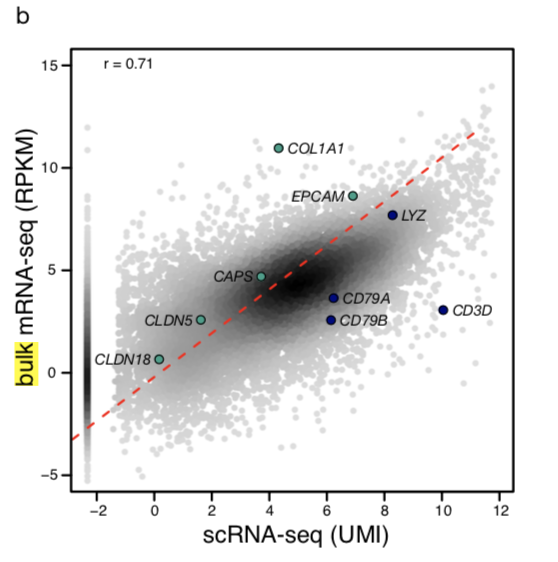
还可以比较bulk转录组测序和单细胞测序能区分的细胞亚群。
后记
这可以说是最中规中矩的一篇单细胞转录组文章了,而且细胞数量非常可观。