2018年发表于science杂志,文章是:Single-cell transcriptomes from human kidneys reveal the cellular identity of renal tumors. 一句话描述:
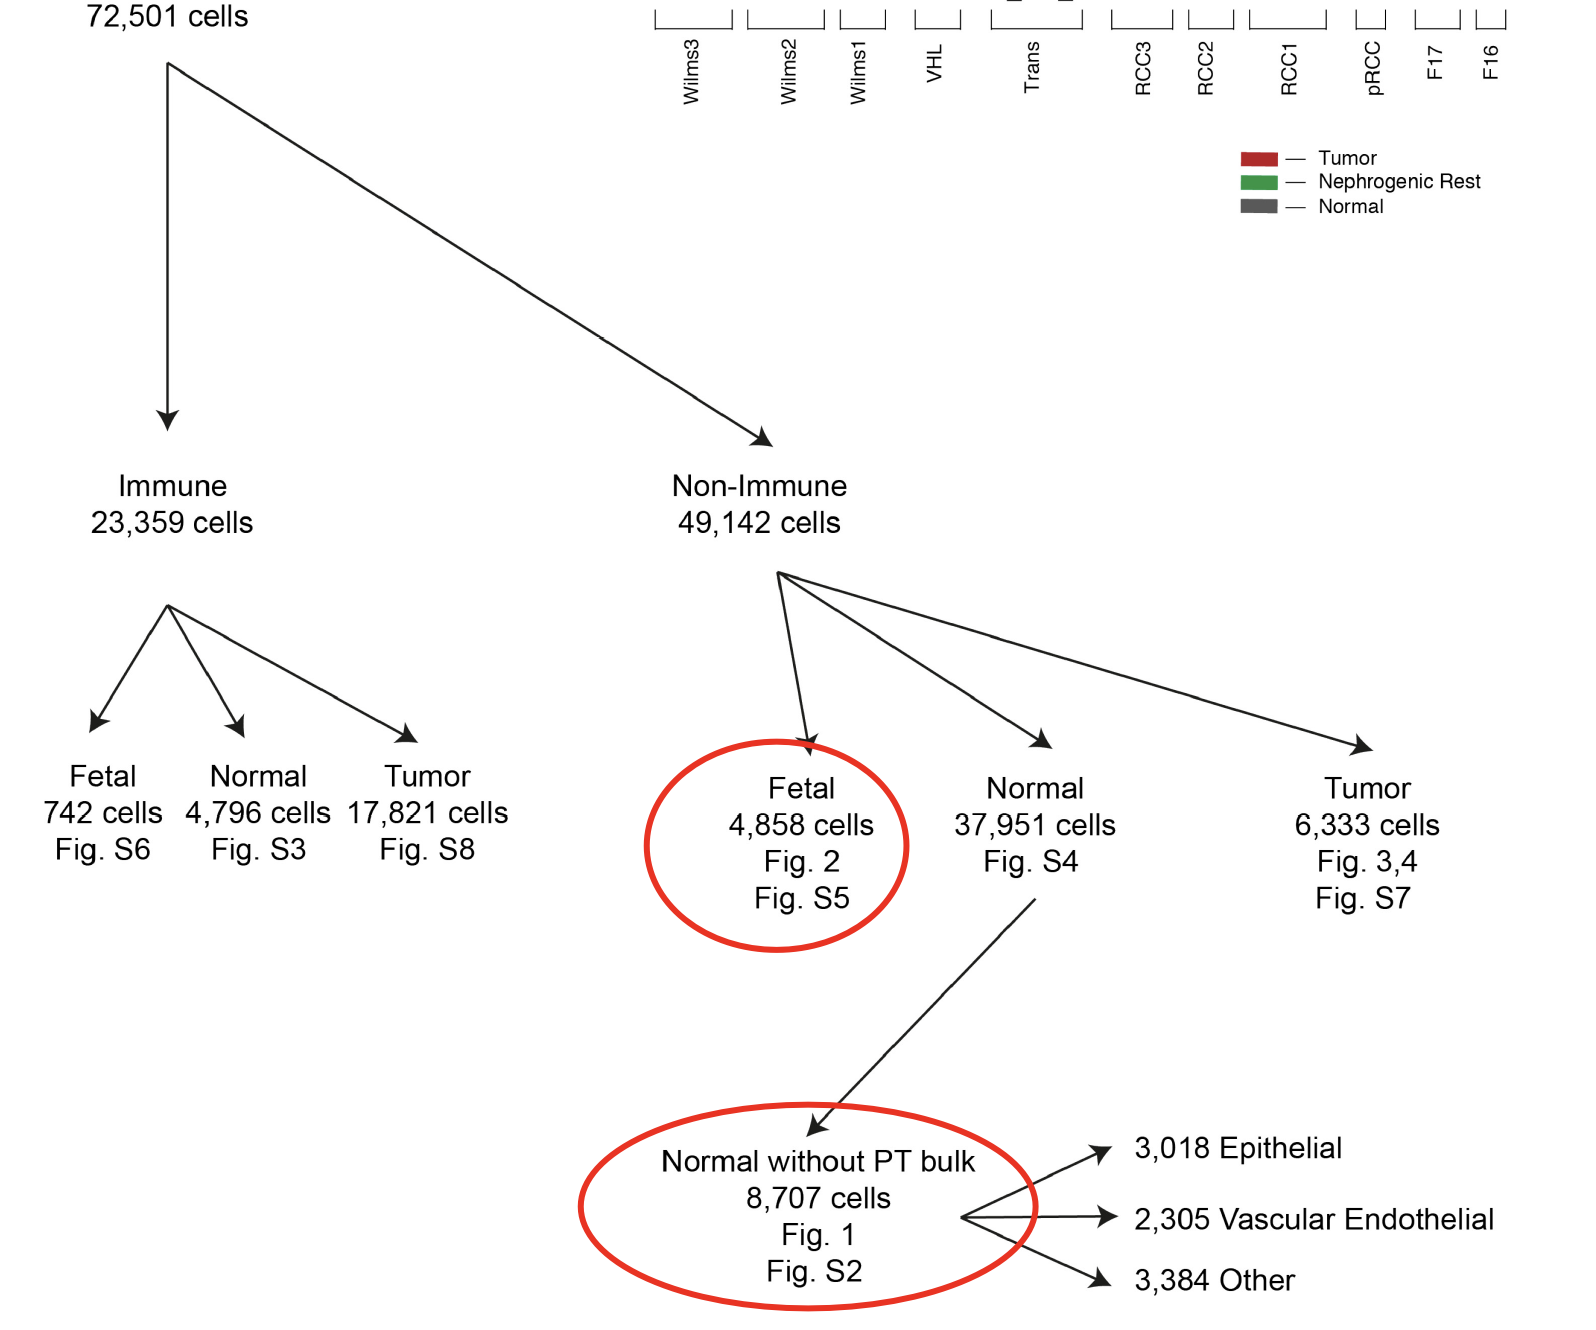
We studied 72,501 single-cell transcriptomes of human renal tumors and normal tissue from fetal, pediatric, and adult kidneys.
背景知识
肾癌有十余种亚型,主要包括
- 肾细胞癌(renal cell carcinoma,RCC,约占超过90%的肾癌)
- 移行细胞癌(transitional cell carcinoma)
- 肾母细胞瘤(Wilms’ tumor)
解析复杂的肾癌组织内部成分有助于研究其发生机制、细胞类群及功能状态,具有重要的临床指导意义。
获取单个细胞中广谱且量化的信使RNA(messenger RNA,mRNA)信息,也就是单细胞转录组技术,使得研究者可以推断肿瘤细胞的来源及其恶性化过程的转录轨迹,为癌细胞的鉴定工作提供了新的策略。
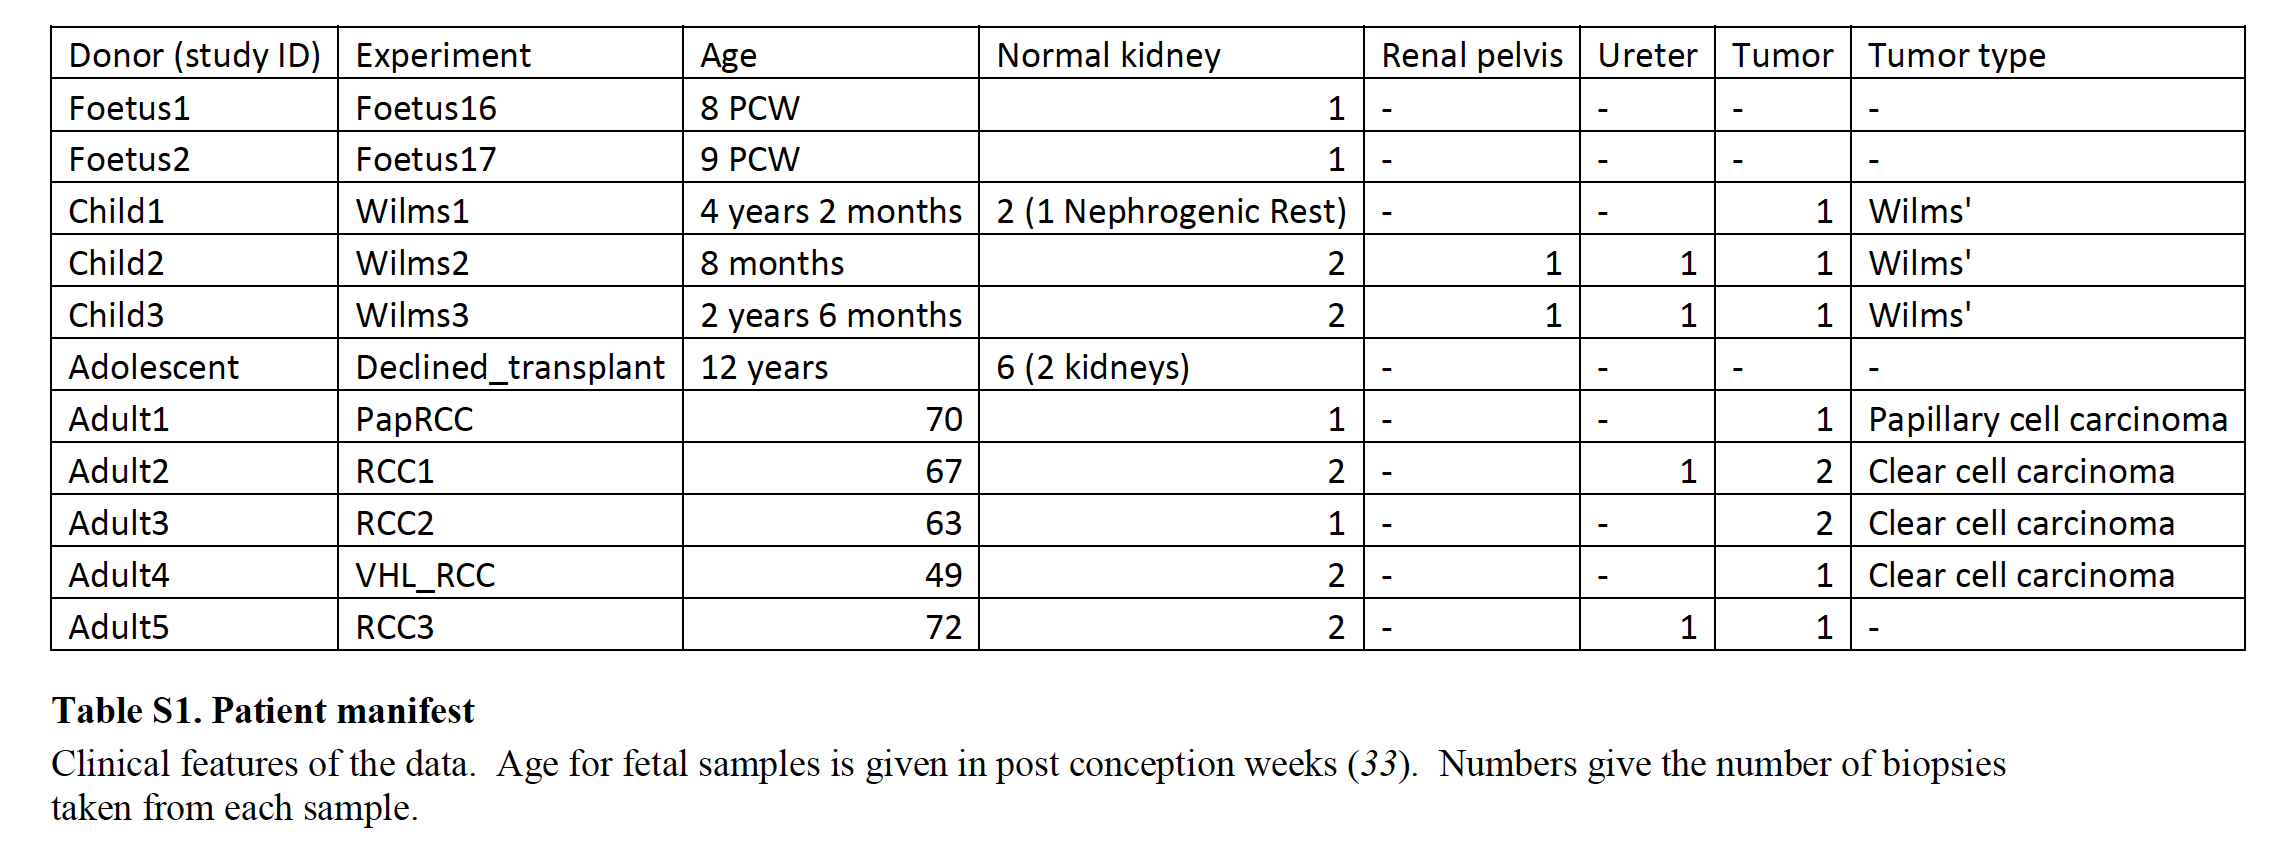
研究对象是7个肿瘤患者还有部分健康人的组织,总共72,501细胞,包括: - 3例肾母细胞瘤(Wilms’ tumor)
- 3例肾透明细胞癌(clear cell renal cell carcinoma,ccRCC)
- 1例乳头状肾细胞癌(papillary renal cell carcinoma,pRCC)
- 健康的2例胚胎
- 健康的3例幼儿
- 健康的2例青少年
- 健康的5例成人肾脏样本
- 健康的4例输尿管样本。
详细列表如下;
细胞数量可以说是非常可观了。10X的单细胞转录组测序
测序数据在 European Genome-phenome Archive (EGA) under study IDs EGAS00001002171, EGAS00001002486, EGAS00001002325, EGAS00001002553 and EGAS00001002534. 意味着不是那么方便下载数据重新分析,不过只要有表达矩阵也可以。
- 上游数据分析:Single cell RNA-seq data were quantified using the 10X software package cellranger (version 1.3.1) to map sequencing data to version 1.2.0 of the build of the GRCh38 reference genome supplied by 10X.
- 表达矩阵过滤: we removed any cells that had greater than 20% expression originating from mitochondrial genes or expressed fewer than 200 distinct transcripts. 由12万过滤到剩下7.8万单细胞。
数据分析,走的是seurat标准流程,使用前30个主成分,进入tSNE进行可视化,然后使用FindClusters函数分群,这里的resolution 参数设置为1,理由是:
We chose this value of the resolution parameter as it produced a number of clusters that was large enough to capture most of the important biological variability but not so large as to make detailed manual scrutiny of each cluster impractical.聚类分析
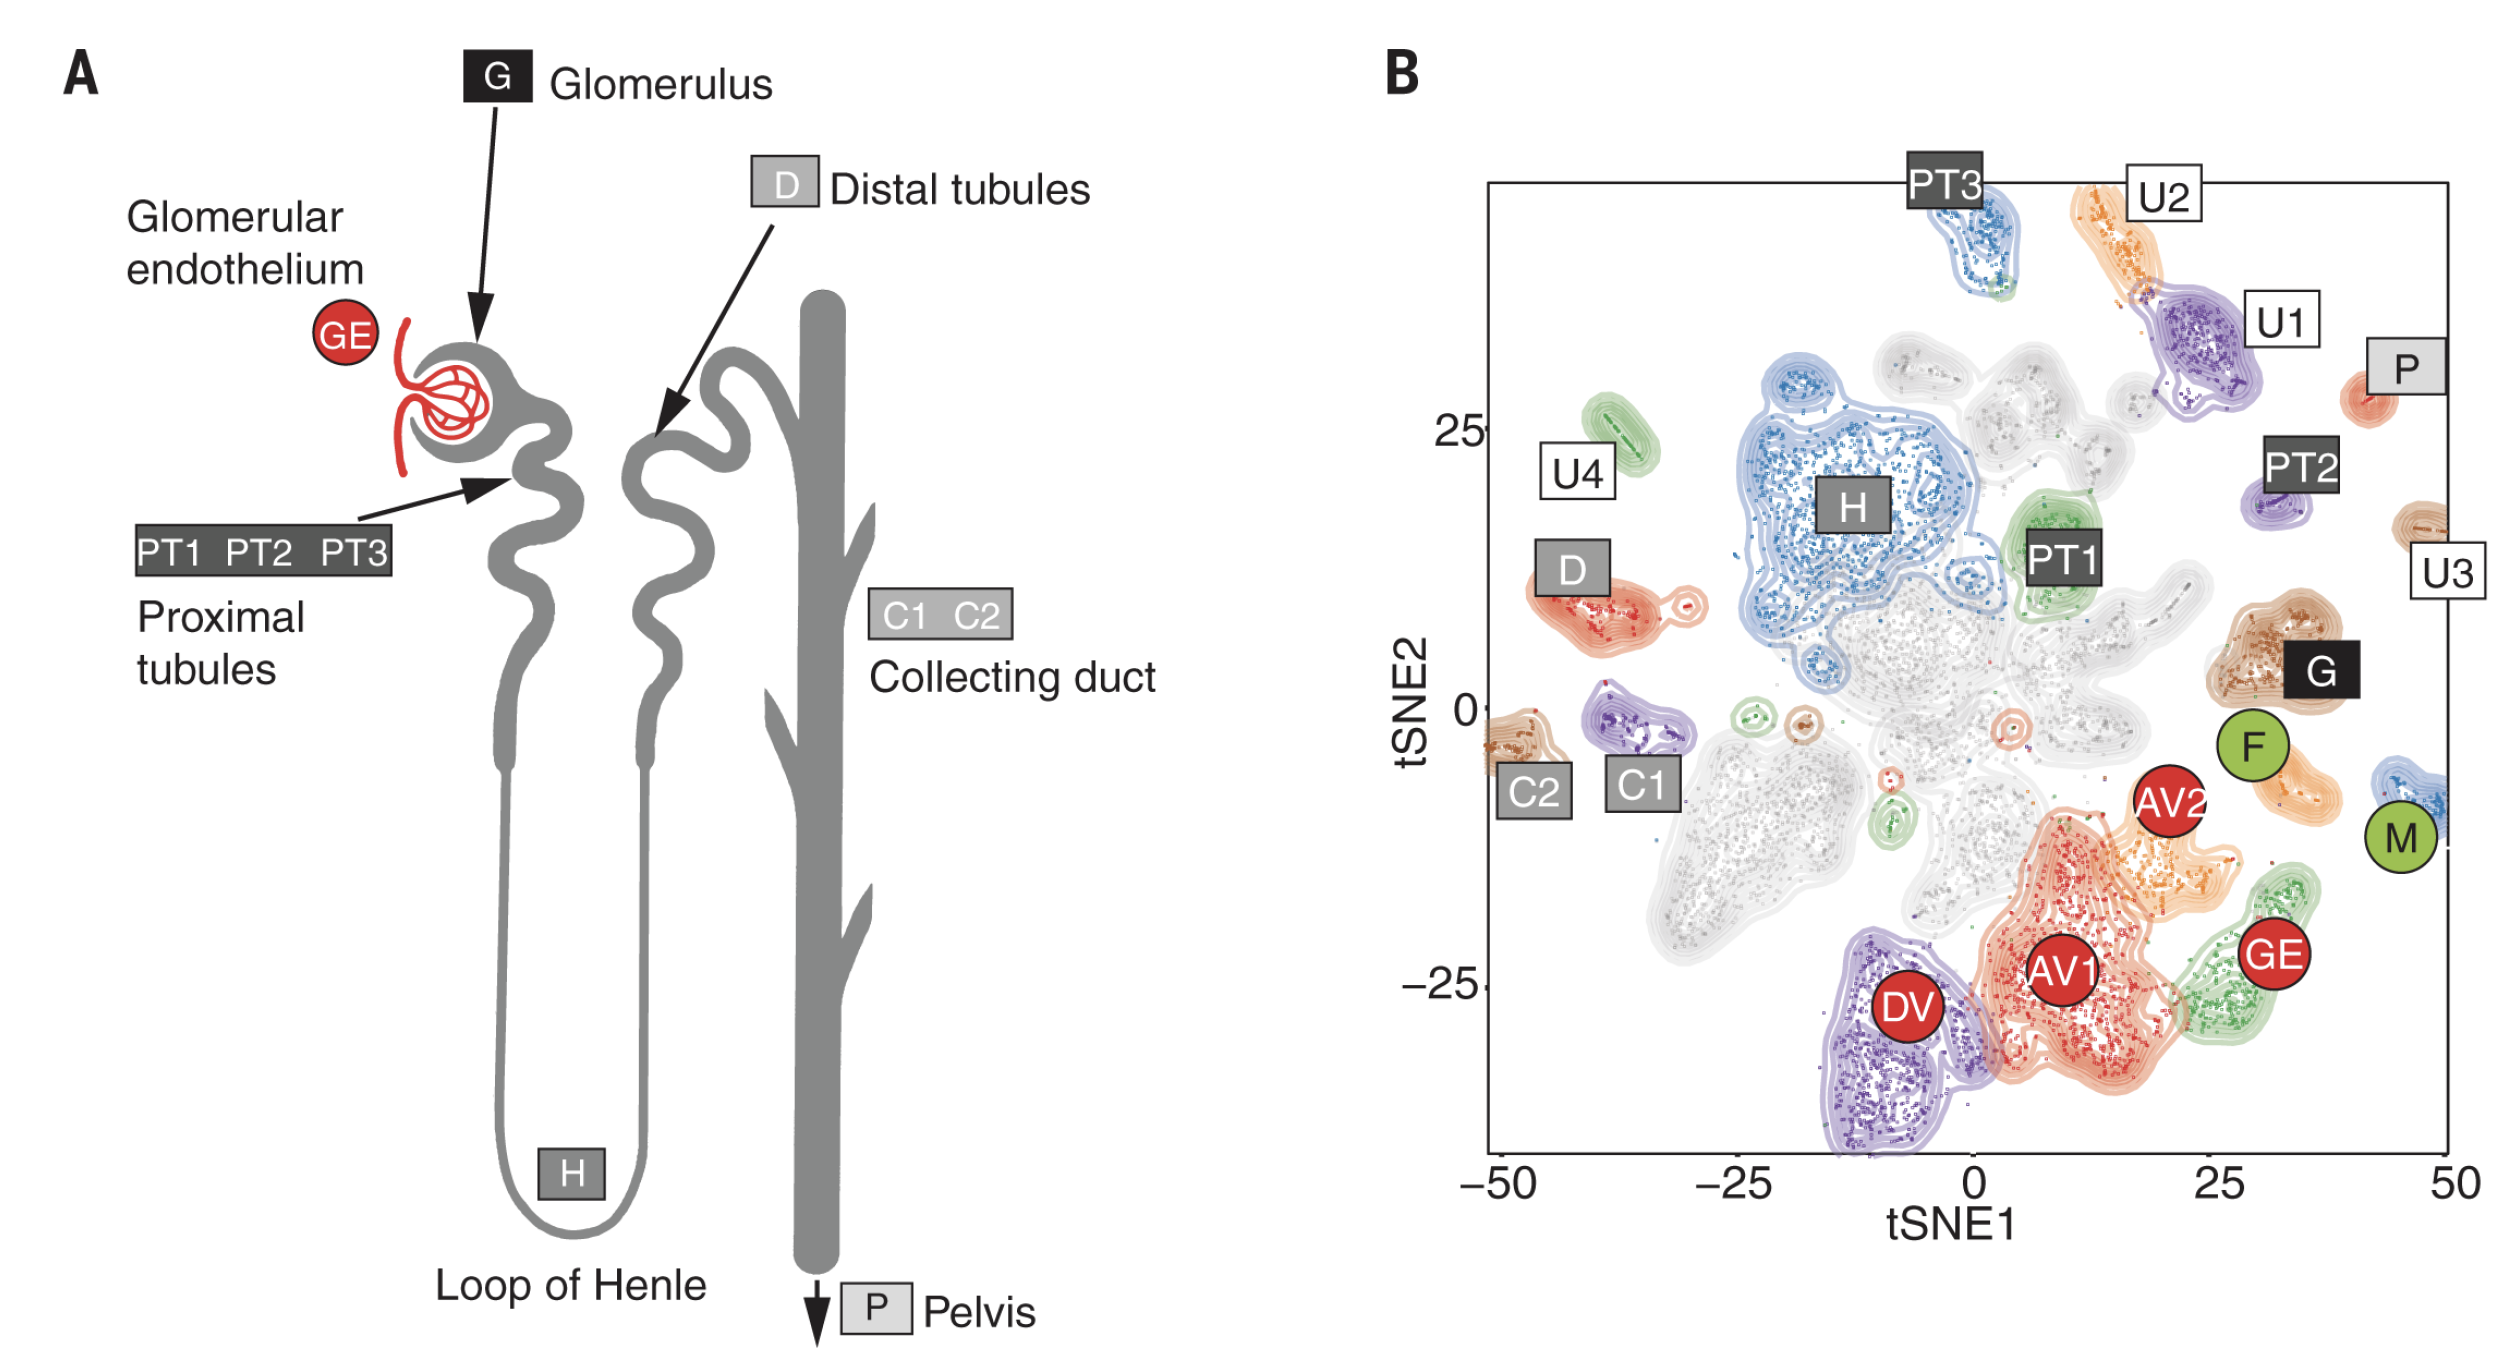
研究人员首先分别对所有细胞进行了聚类分析,基于所得不同类群的正常成熟细胞和胚胎细胞的转录组特征构建了基准图,描绘了两个图谱,如下:
成熟肾脏图谱: - 上皮细胞 epithelial
- 近端小管细胞
- 成纤维细胞
- 肌纤维母细胞
- 血管内皮细胞
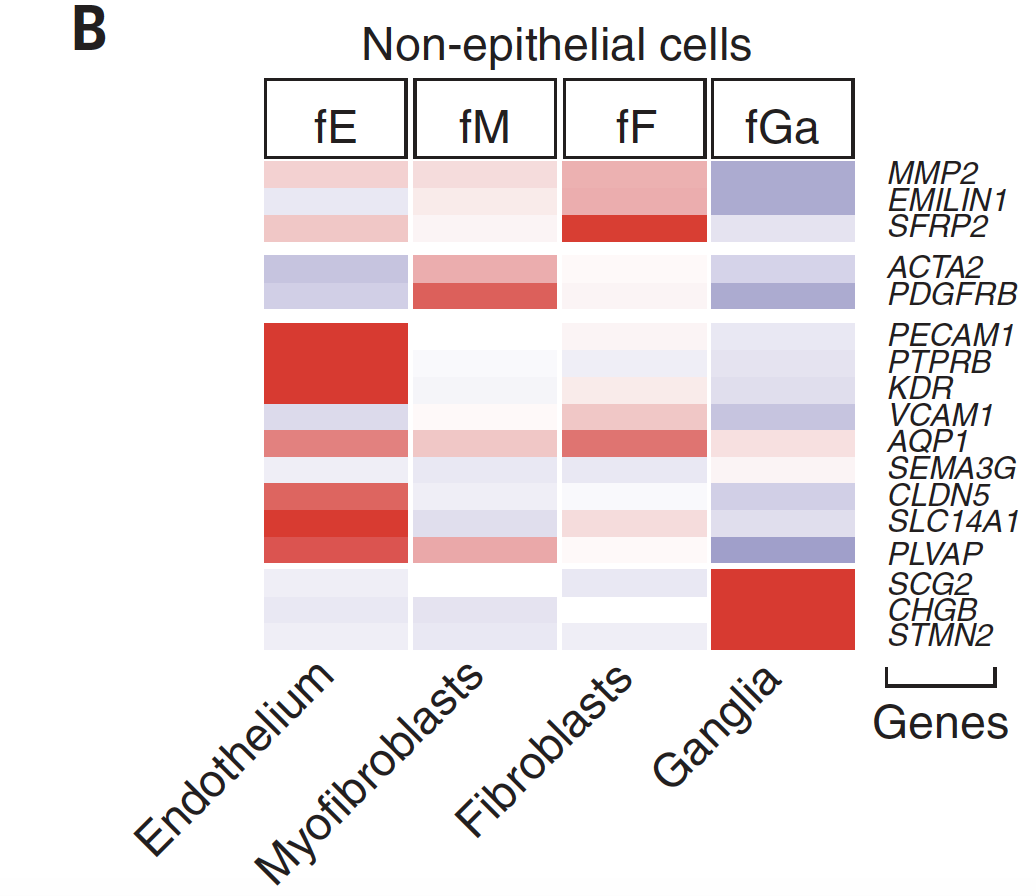
以及发育中的的胚胎肾脏图谱,包括: - 肾小管细胞
- 成纤维细胞
- 肌纤维母细胞
- 血管内皮细胞
- 神经节细胞
并进一步鉴定出与肾小管发育过程相关的转录因子。
使用tf-idf ranking 方法找细胞亚群特异性表达基因
这个算法需要仔细学习。
细胞亚群命名
每次到这个环节,都是最折磨人的,看别人的文章很轻松就把每个细胞类型命名了,实际上后面的工作量很惊人。
Annotation of clusters to cell types was done by manual inspection of the genes defining each cluster and comparison to the literature.
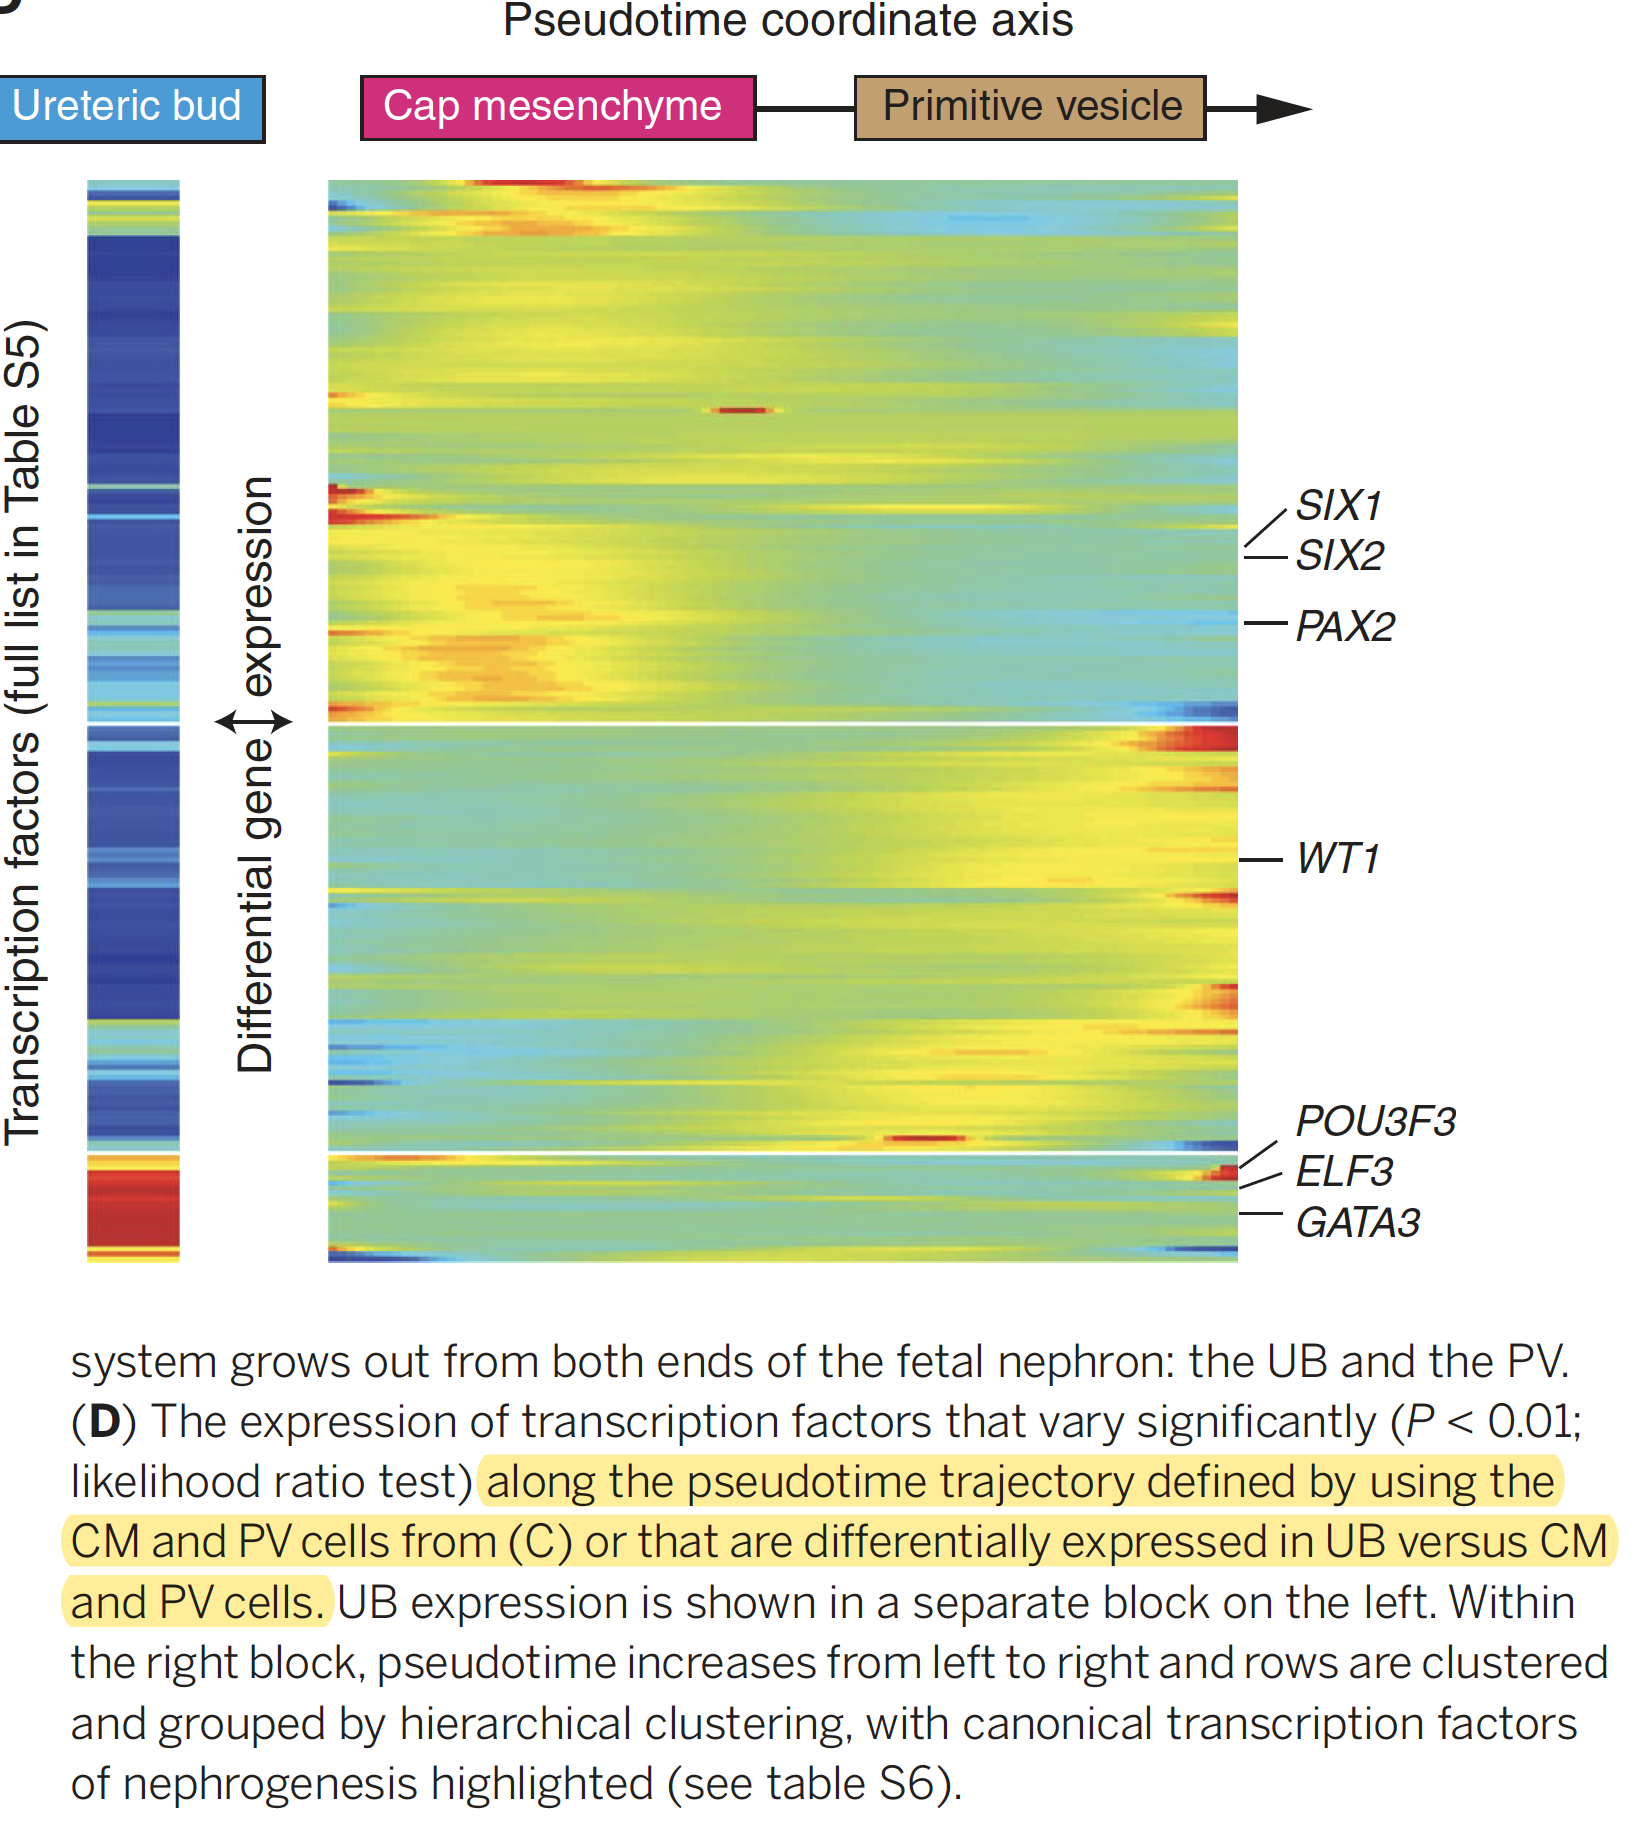
拟时间分析
这里就使用了monocle 包,标准分析步骤:
To identify genes which changed steadily along the identified trajectory we performed a likelihood ratio test for a negative binomial model with and without a term given by spline smoothing of the pseudo-time using the “differentialGeneTest” function.8,707个normal epithelial and vascular cells.的分类情况
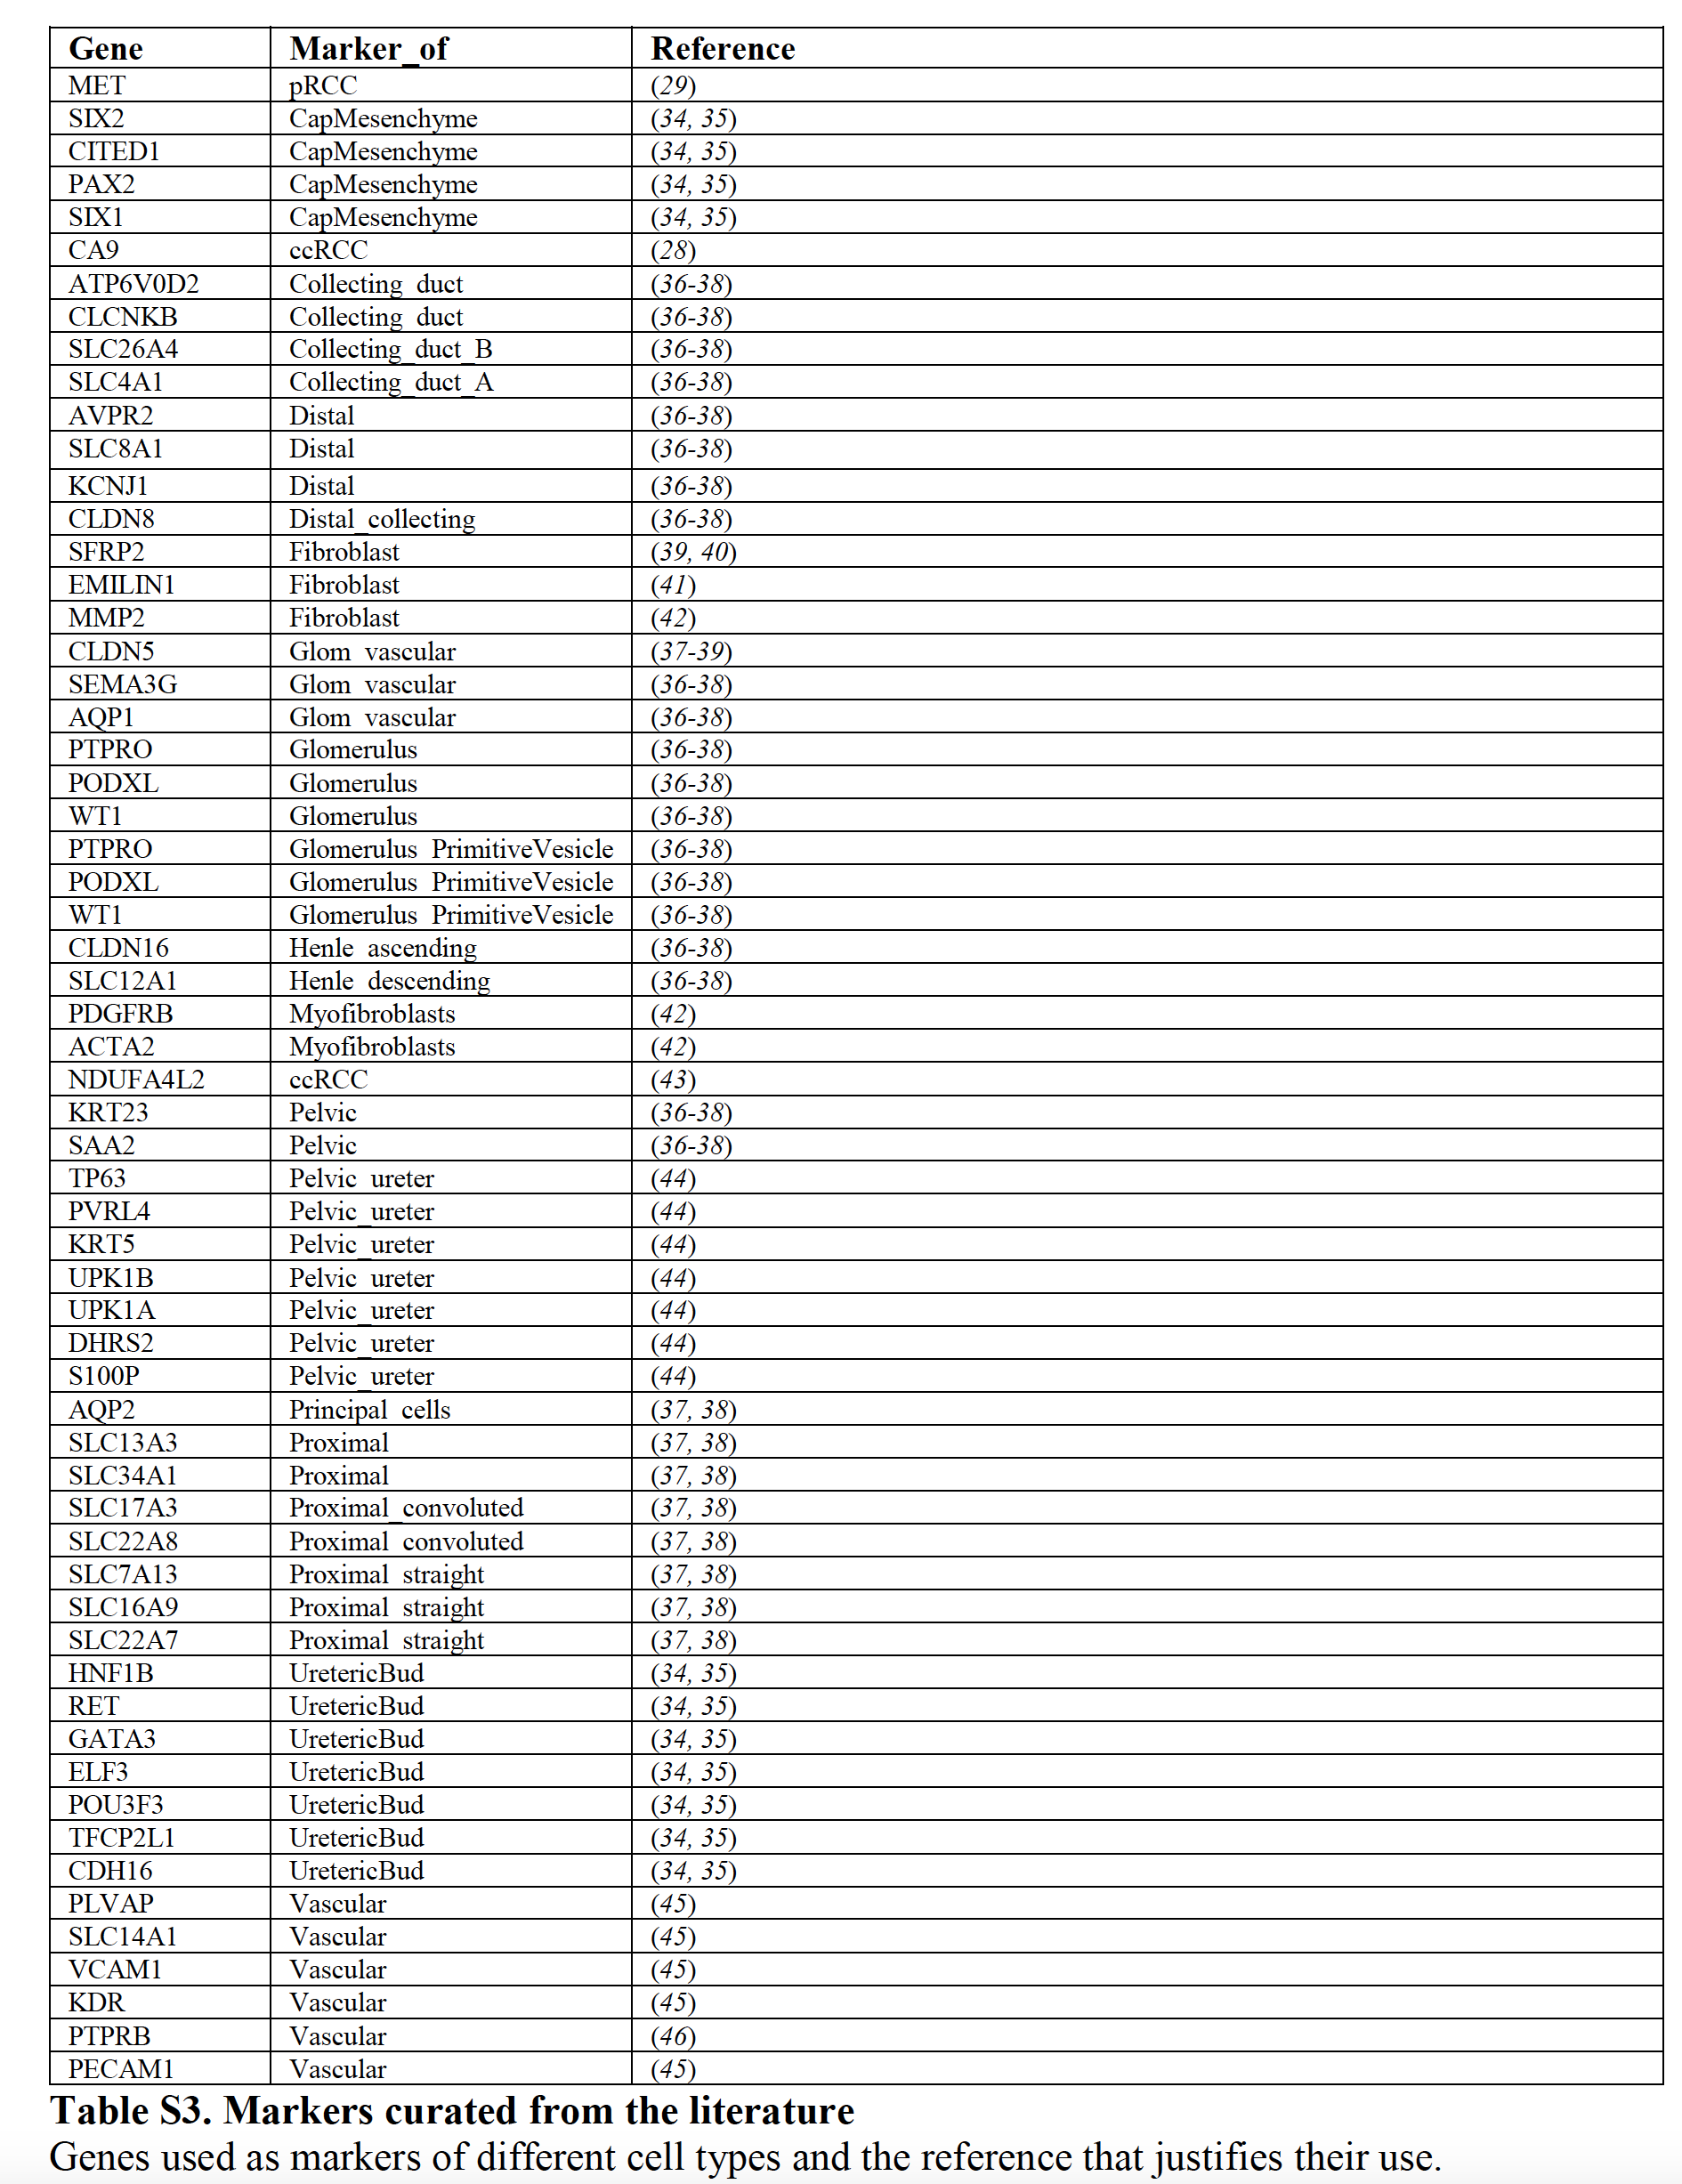
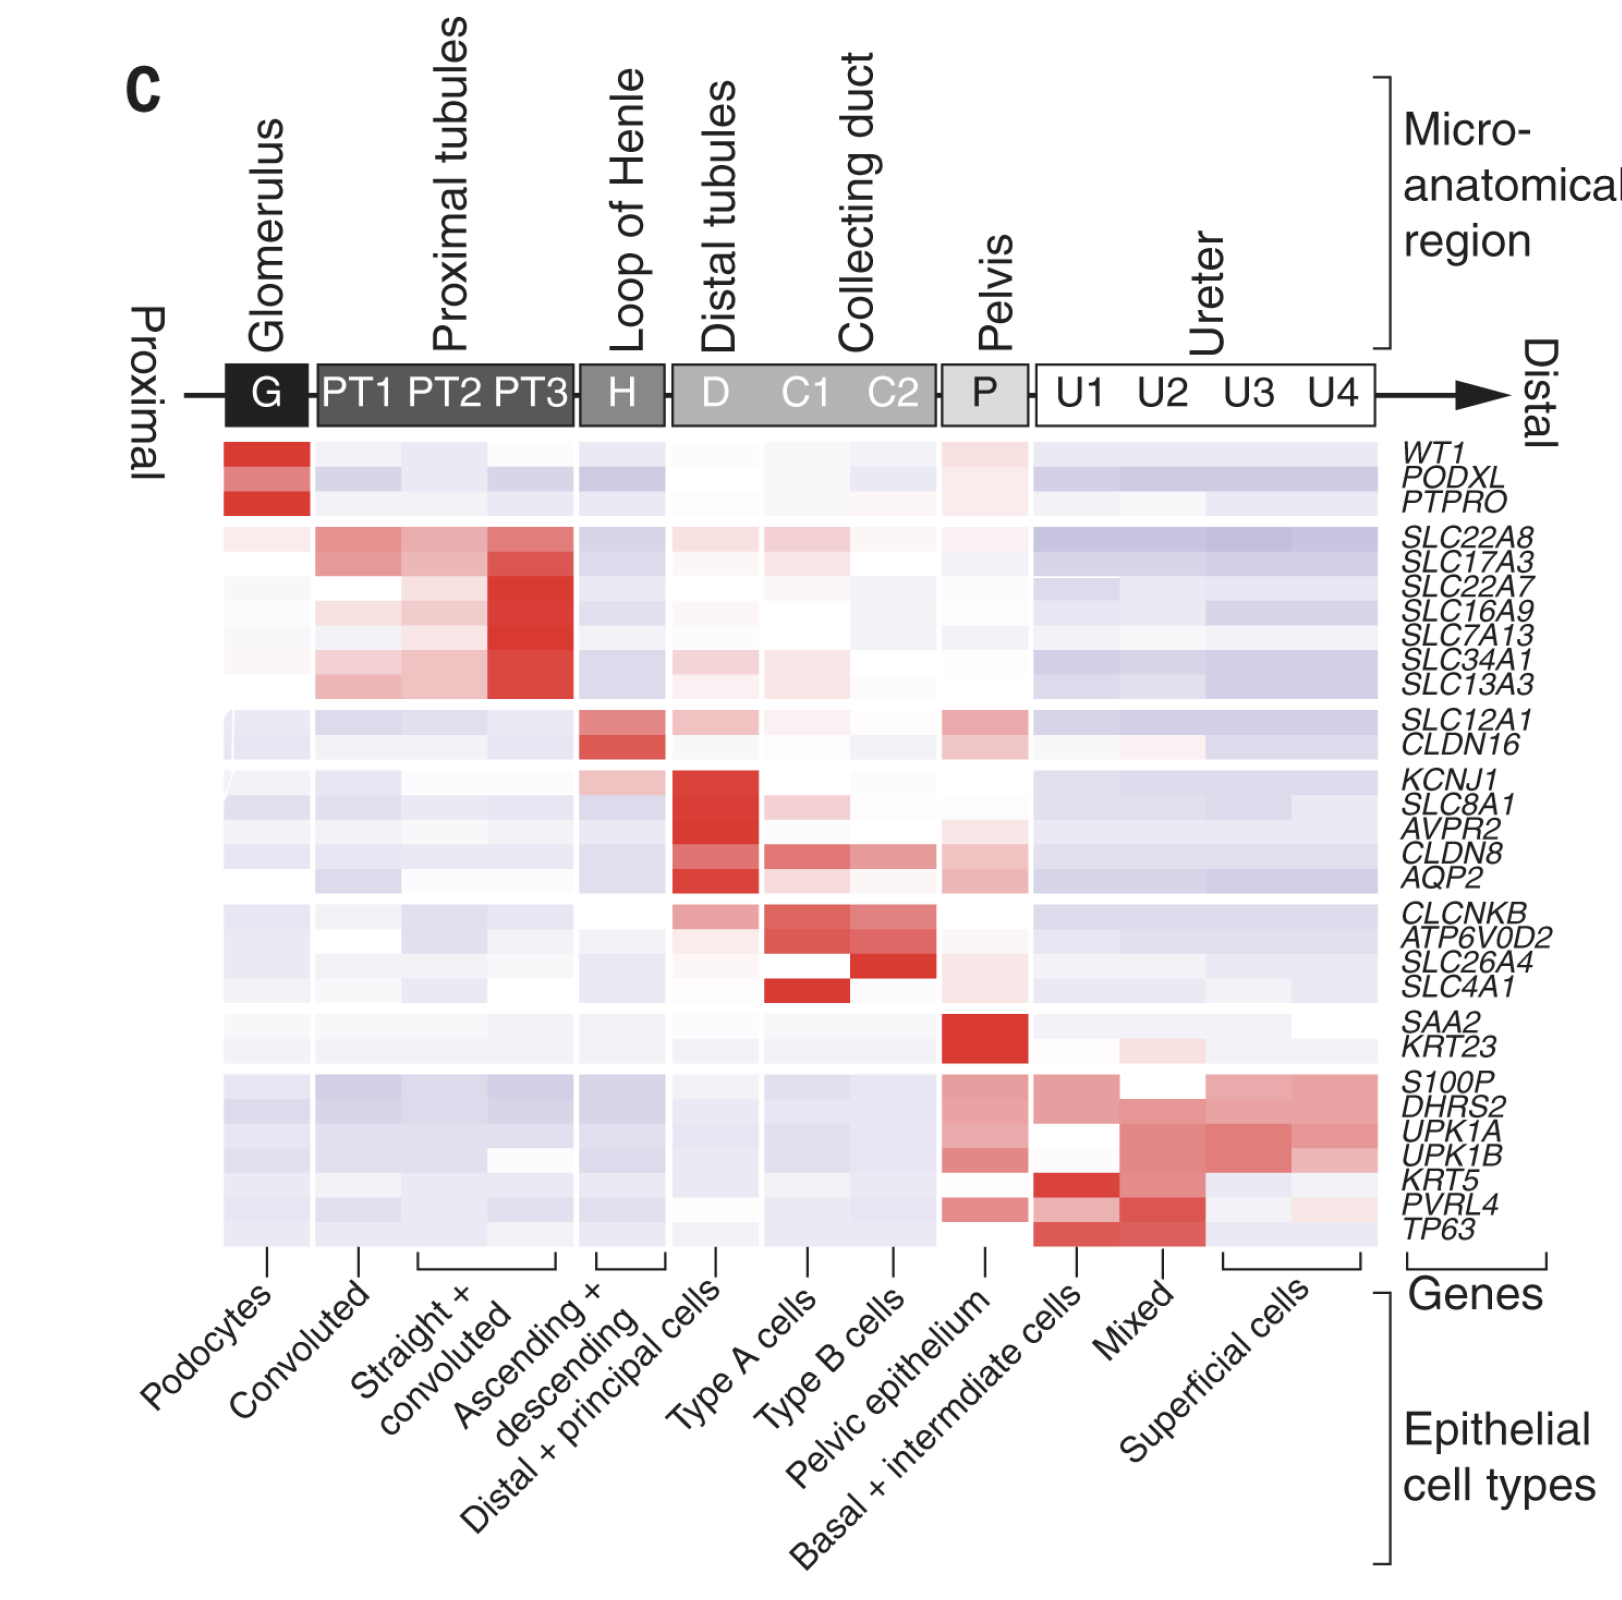
需要掌掌握kidneys发育背景知识,才能把细胞类群命名并且映射到kidneys的解剖学示意图。
这些重要的不同细胞类群的标记基因如下;
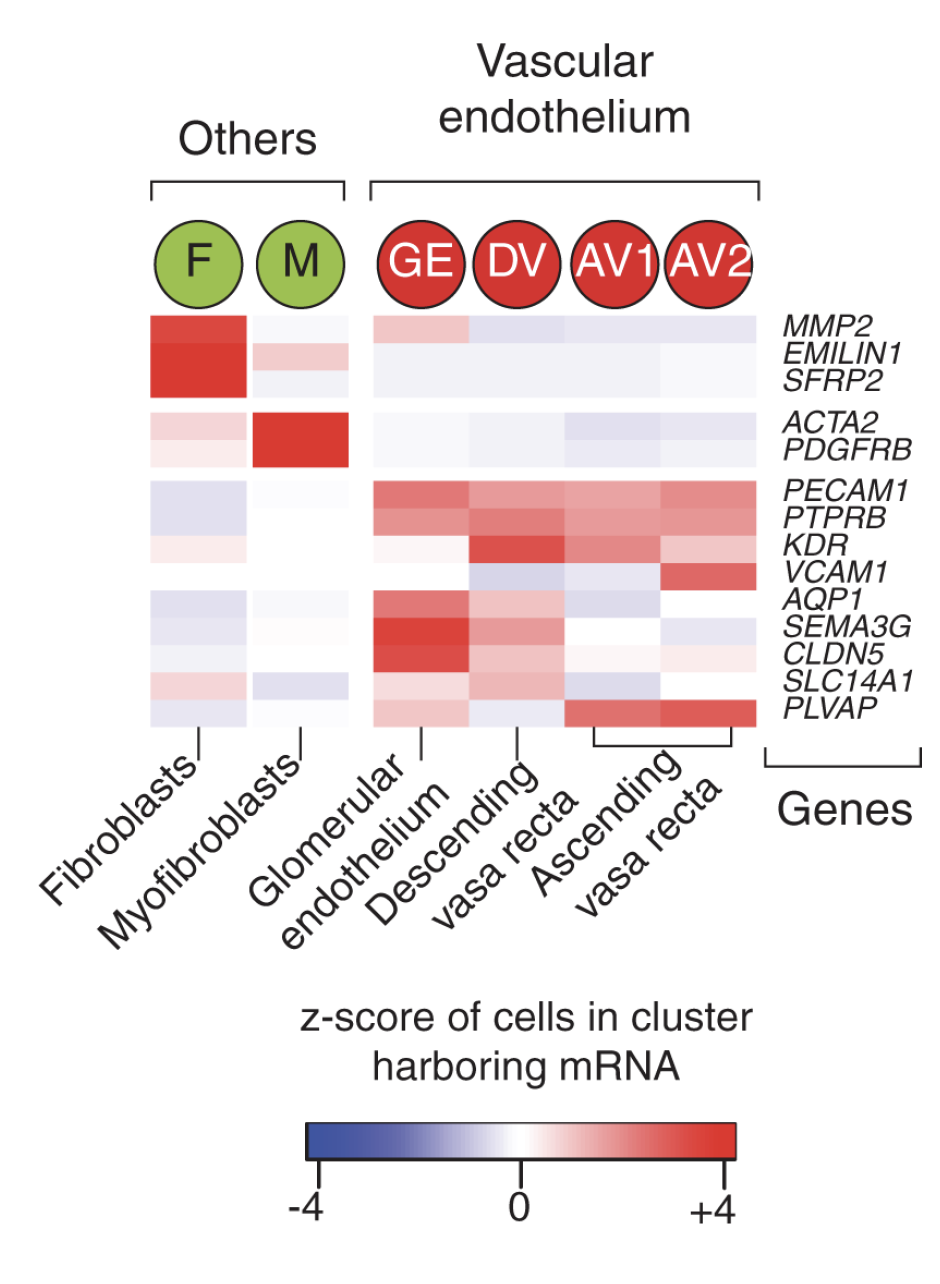
部分其它细胞类群标记基因是:
4,858 个fetal epithelial and vascular cells的分类情况
拿到表达矩阵,走数据降维后tSNE图如下:
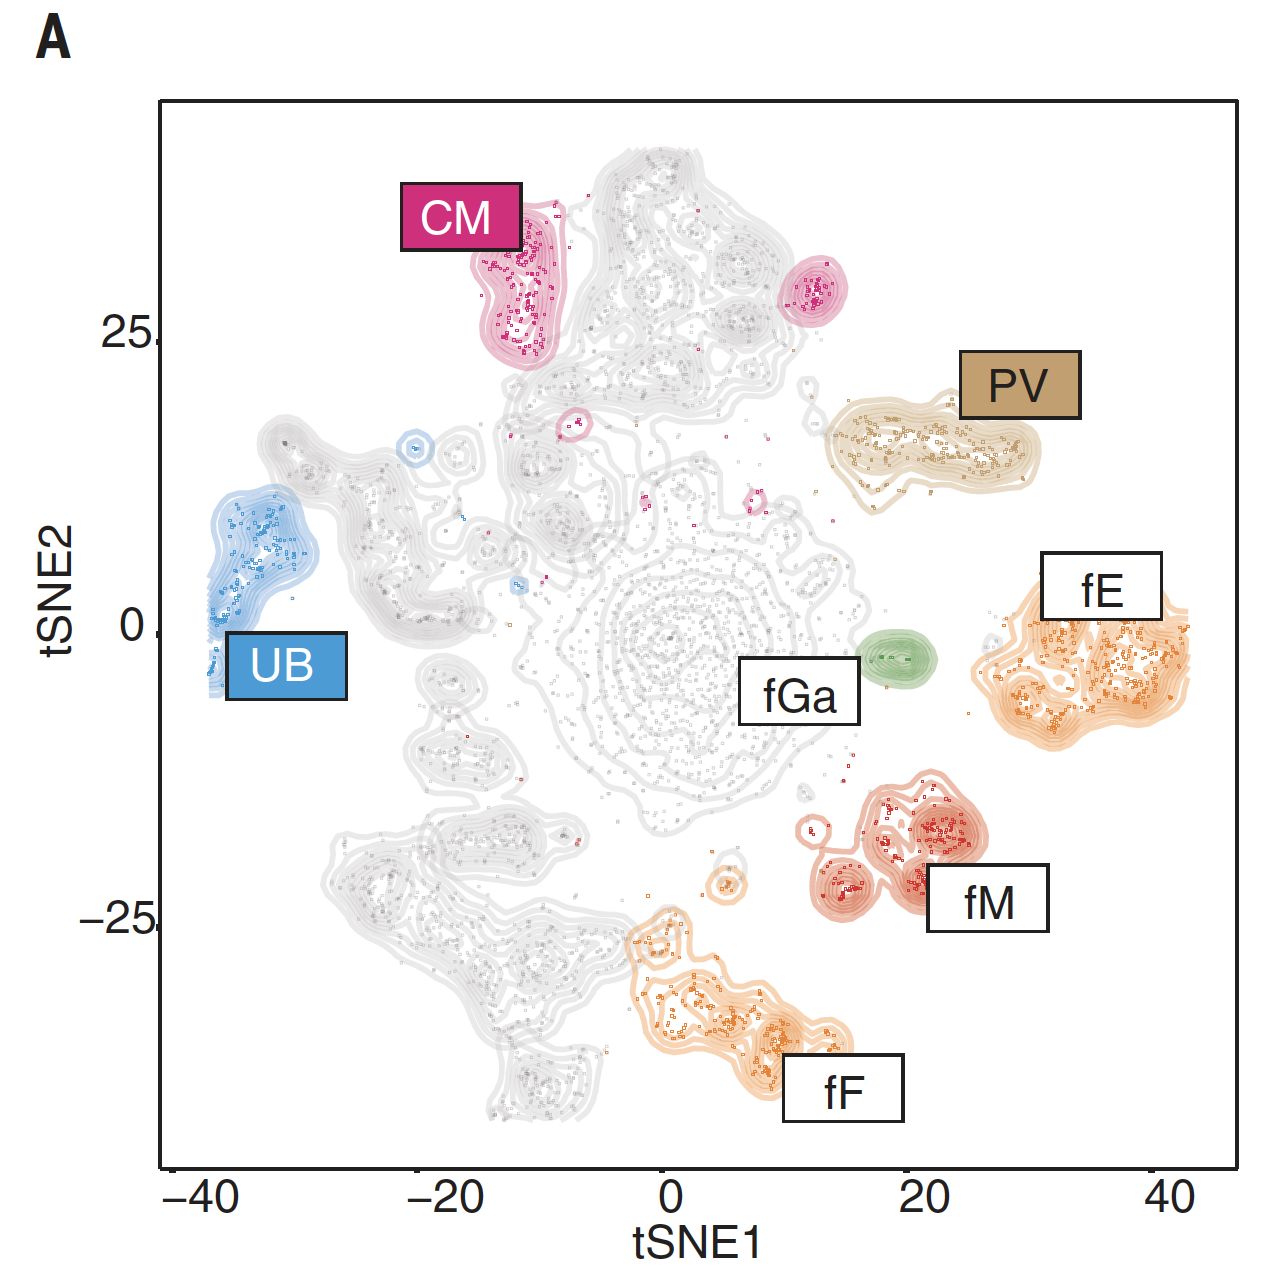
其中部分细胞类群标记基因是:
另外部分细胞类群标记基因是:
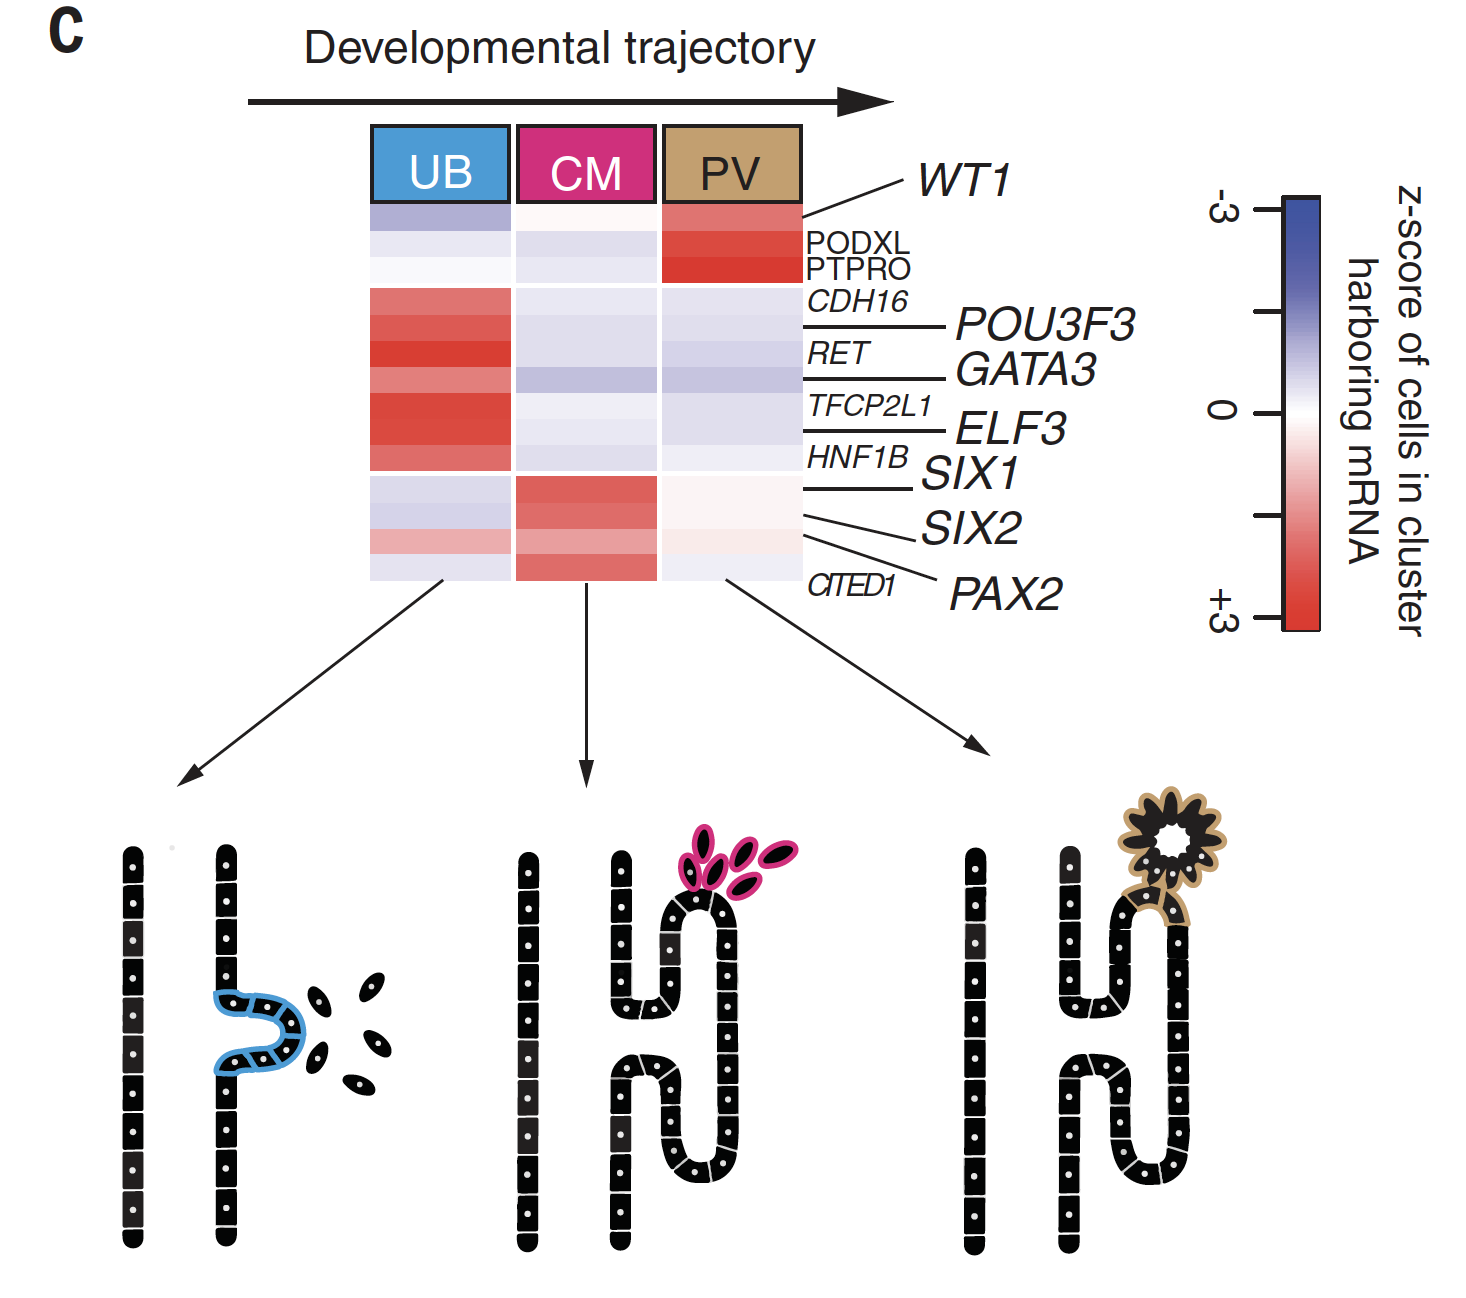
挑选差异表达基因,来做拟时间分析,其中UB,CM,PV的发育顺序是:
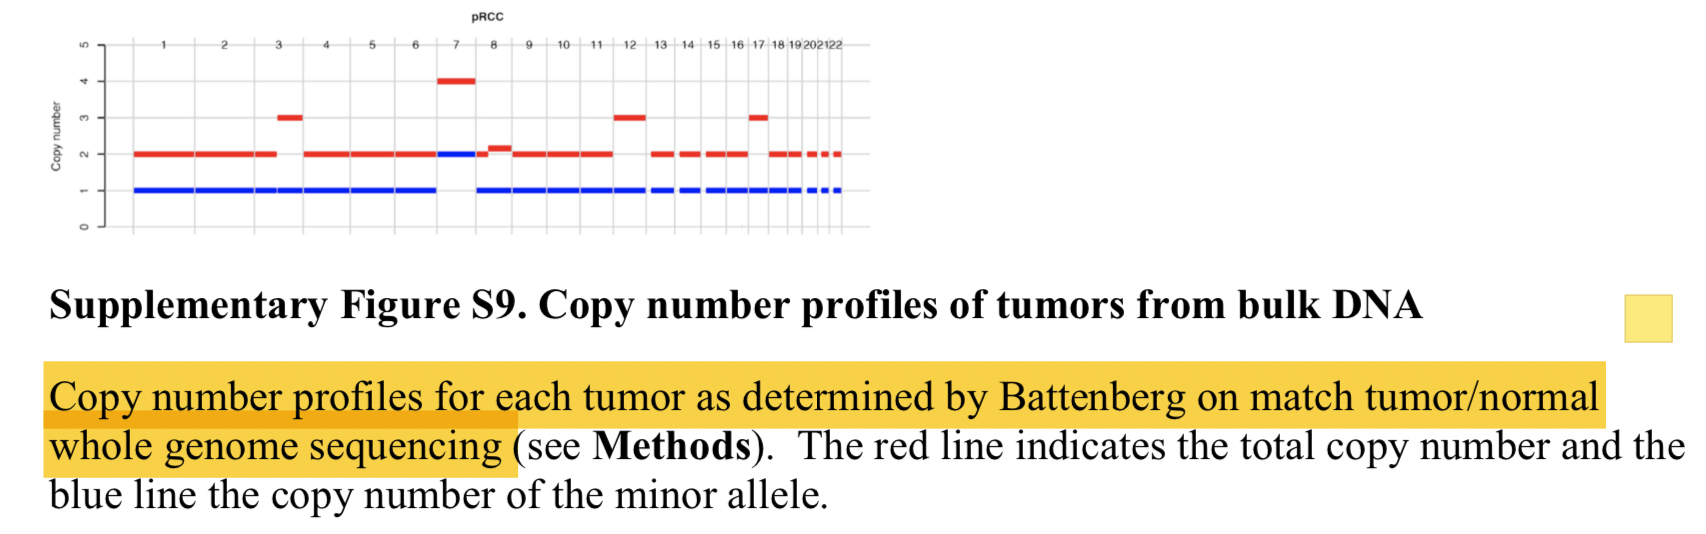
bulk DNA的CNA信息
文章使用的是ascatNGS , to estimate tumor purity and ploidy and to
construct copy number profiles prior to running the Battenberg algorithm (v2.2.5)
(github.com/cancerit/cgpBattenberg) to allow for tumor subclonality.
如下,看起来跟 sequenza软件结果比较类似。