发表于Cancer Cell. 2018 Sep 10;文章是:Overcoming Resistance to Dual Innate Immune and MEK Inhibition Downstream of KRAS. 主要探究的是耐药性,用的是细胞系,但是这篇文章我最关心的是研究团队对转录组和表观数据的结合,还有对CCLE和TCGA这样的公共数据库的挖掘利用。
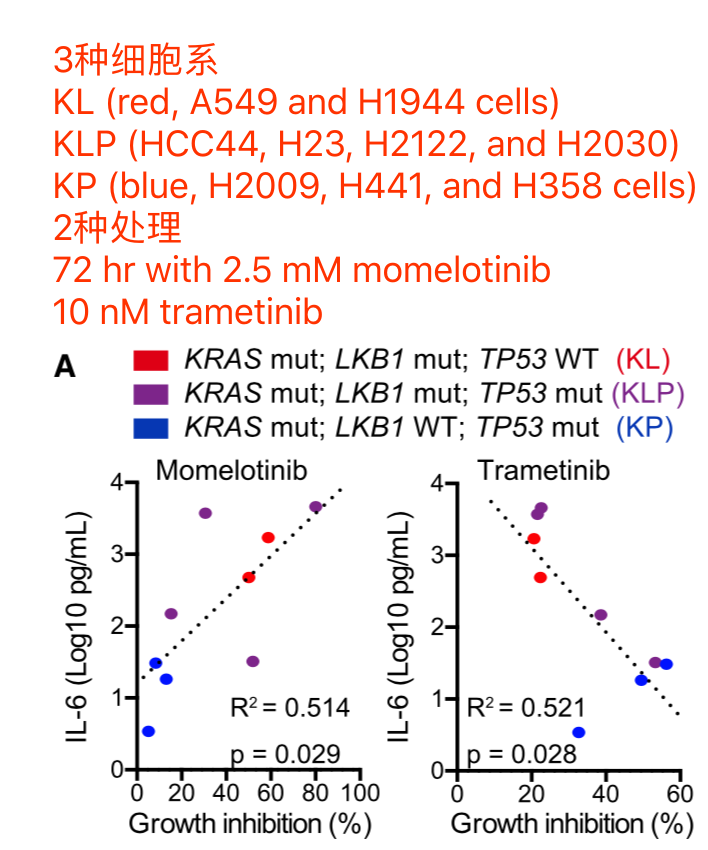
需要补充很多细胞系知识和药物知识,反映在下面这张图上面:
数据都在NCBI:
- The accession number for the RNA-seq data reported in this paper is GEO: GSE96779.
- The accession number for the ChIP-seq data reported in this paper is GEO: GSE96780.
不幸的是:Accession “GSE96779” is currently private and is scheduled to be released on Mar 16, 2020. 虽然现在还不能下载,但是只要这个数据集正式公开,就是一个绝佳的例子。ChIP-seq 数据处理流程:
很中规中矩的流程,没什么好说的,重点就是找到peaks即可: Sequenced reads from histone H3K27 acetylation ChIPed DNA were aligned to hg19 using Bowtie2 with -k mode 1 and enriched ChIP peaks were called by MACS algorithm at the threshold of p < 1x10⁻⁵.
找到peaks后续的下游分析也比较简单:Peak signals from two sets of the ChIP peaks (MSR-A549 cells vs. A549 cells) were normalized using MAnorm algorithm and 4,251 peaks were identified to be significantly increased on MSR-A549 cells at the arbitrary threshold at p < 1x10-25.
主要是和转录组数据结合,如下;
RNA-seq 数据处理流程:
同样是很中规中矩的流程,而且是非常老旧的流程,可能是因为惯性的力量,不过通常我们认为老旧的流程并没有什么定量准确性的问题,只不过是速度慢了一点而已。当然我还是推荐大家转为 hisat2+featureCounts 流程: Sequenced reads from RNA-seq were aligned with Tophat aligner to UCSC Refgene hg19. Transcripts were quantified using Cufflinks and differentially expressed transcripts were identified by Cuffdiff.
组学联合分析
前面提到的ChIP-seq数据得到peaks后面就可以跟RNA-seq结合,分析如下:
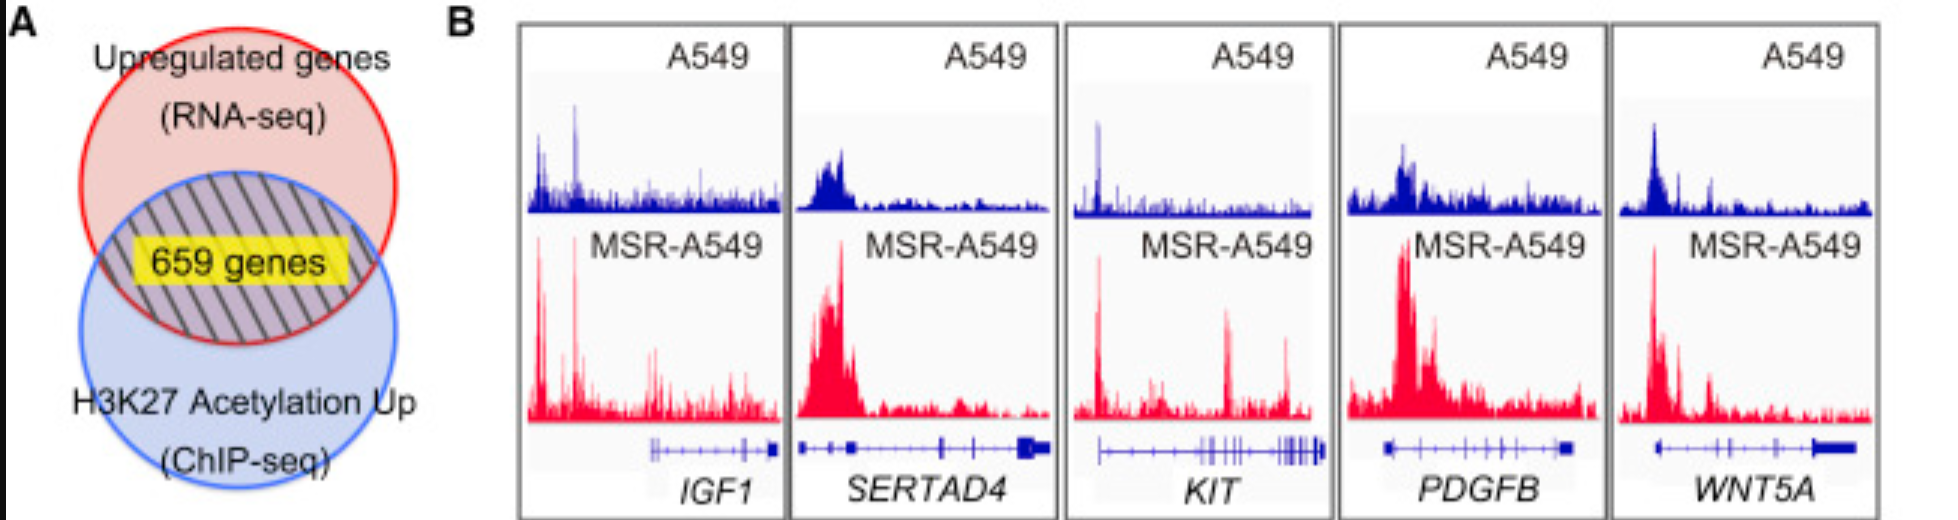
Those 4,251 peaks with increased signal upon resistance were assigned to genes potentially contributed for its expression using Citrome BETA tool. Of those genes, 986 genes were identified to have their expression also significantly increased in MSR-A549 cells to momelotinib/selumetinib treatment at FDR q < 0.25.
From the resulting genes, 659 genes were identified by selecting genes with the average of RPKM in MSR-A549 cells > 0.1 and fold change of average RPKM (MSR-A549 cells/A549 cells) > 1.5, and shown in Table S1 as resistance-related genes.
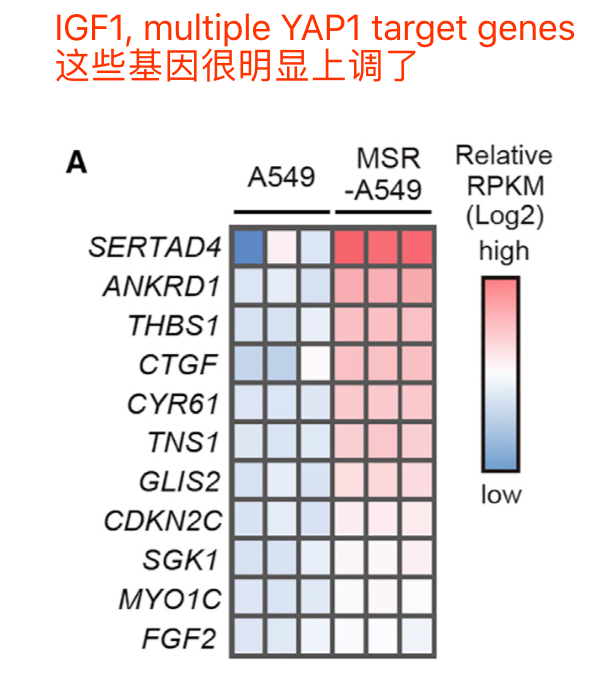
表达矩阵最直接的利用是热图看感兴趣的基因集的上调下调情况,比如:
CCLE 数据库辅助:
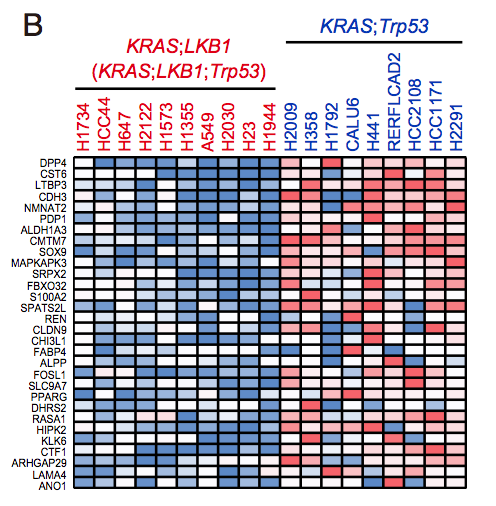
Lung adenocarcinoma cell lines in CCLE repository are subdivided into 2 classes
- KP (n = 9, H2009, H358, H1792, CALU6, H441, RERFLCAD2, HCC2108, HCC1171 and H2291) harboring KRAS and TP53 mutation/deletion with intact LKB1
- KL (n = 10, H1734, HCC44, H647, H2122, H1573, H1355, A549, H2030, H23 and H1944) harboring KRAS and LKB1 mutation
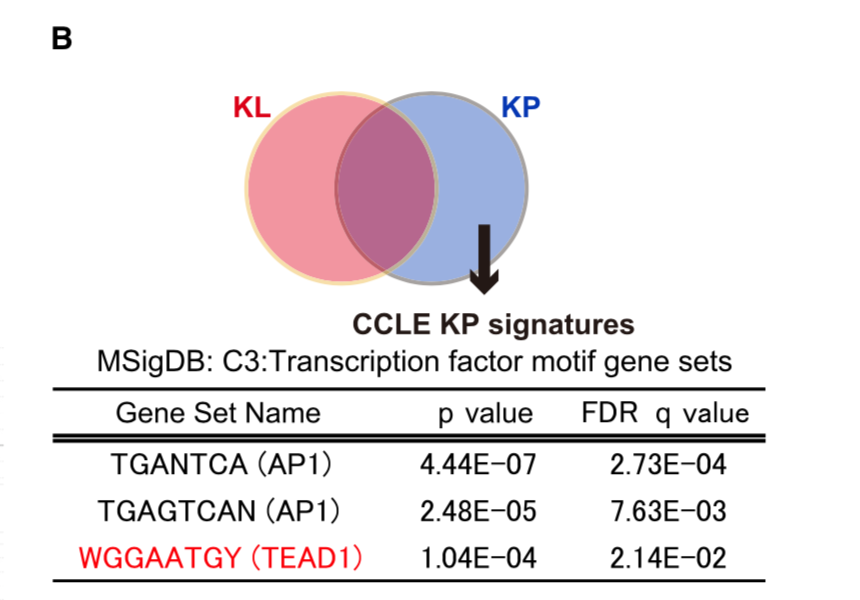
The RPKM values for each cell line was obtained from CCLE repository, and then 386 differentially expressed genes between KP and KL cell lines (p < 0.05 and FDR q < 0.25) were identified using R platform and TCC package (Sun et al., 2013). Of those genes, 168 genes were upregulated specifically in KP cell lines (M > 0, A > 0), and shown in Figure 7B (Top 30 genes) and Table S2 (168 genes).
CCLE数据库的差异分析
CCLE数据库的差异分析的热图:
CCLE数据库的GSEA分析:
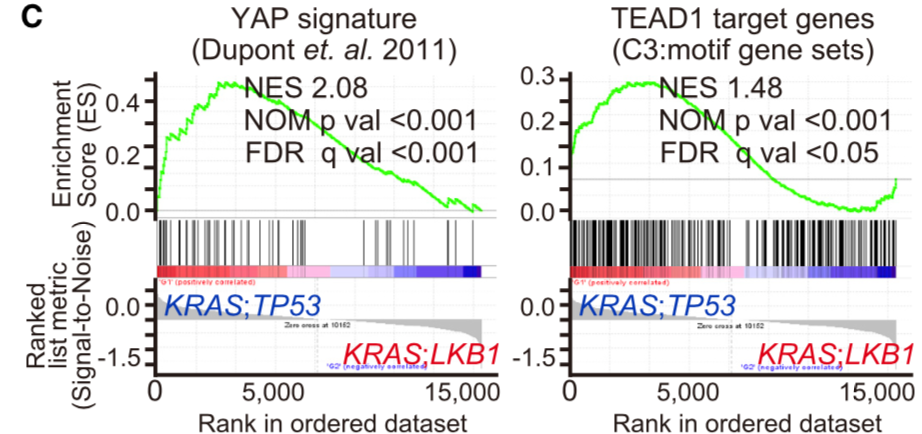
TCGA数据库辅助:
The level3 RNA-seq V2 datasets for lung adenocarcinoma samples were downloaded from TCGA data portal and classified into KP samples or KL samples according to their mutation status (See Table S3). Samples having mutations on both LKB1 and TP53 were excluded. TCGA ID: TCGA-78-7160, TCGA-78-7166 and TCGA-78-7540 were further eliminated because they were previously identified as a different subtype from KP or KL (Skoulidis et al., 2015). Then differentially expressed genes between KP samples (n = 21) and KL samples (n = 17) were analyzed by Gene Set Enrichment Analysis (GSEA) with YAP1 signature (Dupont et al., 2011) and MSigDB C3 signature TEAD1 target.
TCGA数据库里面的病人分组如下:
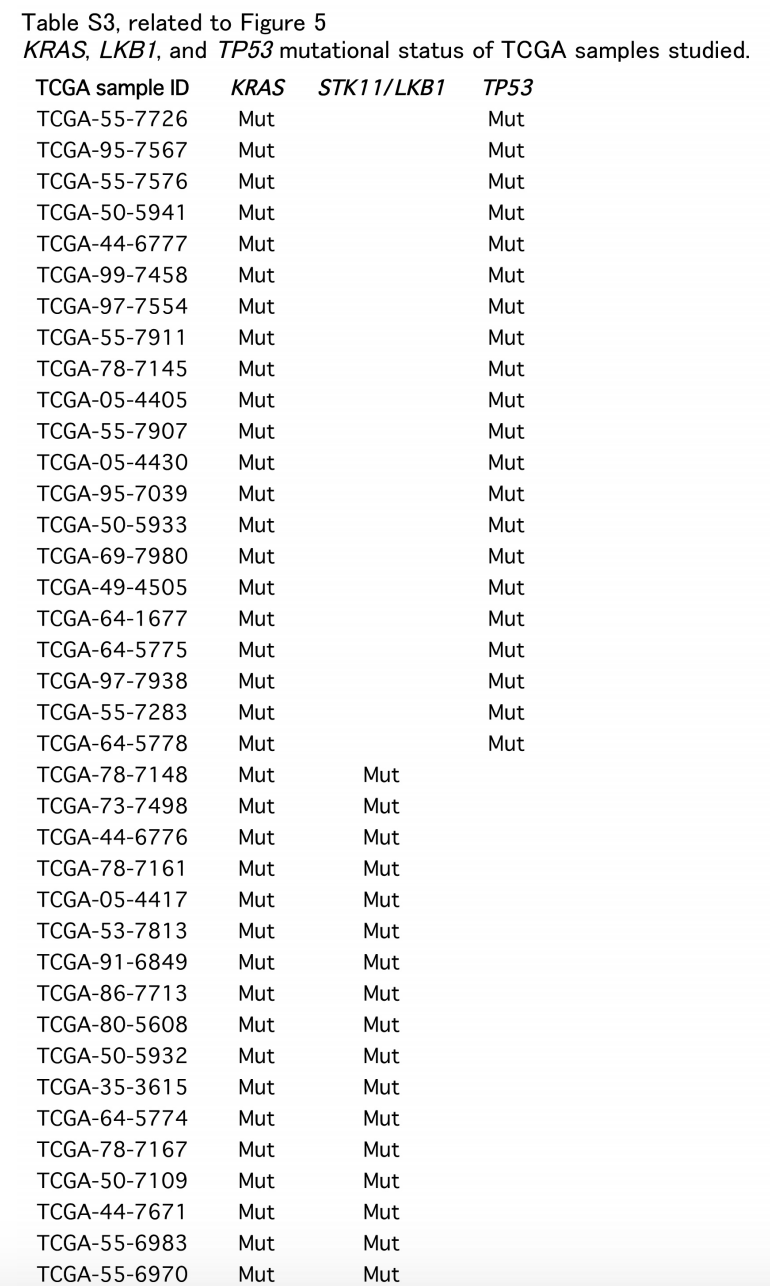
可以做各种各样的分析。
可以说是很中规中矩啦!!!