单细胞转录组数据分析CNV
都来aviv Regev自于实验室,一系列文章都利用了单细胞转录组数据分析CNV。
2014年关于GBM的science文章
首先是2014年关于GBM的science文章;PMID: 24925914 ,提到了这个分析点,然后还用了CCLE数据库验证可靠性。
该文章自己的单细胞转录组数据建库选用了 SMART-seq 方法,公布在 GSE57872
- 430(576) single glioblastoma cells isolated from 5 individual tumors
- 102(192) single cells from gliomasphere cells lines
这个单细胞转录组建库方式有点落后了:
SMART-seq protocol was implemented to generate single cell full length transcriptomes (modified from Shalek, et al Nature 2013) and sequenced using 25 bp paired end reads. Single cell cDNA libraries for MGH30 were resequenced using 100 bp paired end reads to allow for isoform and splice junction reconstruction (96 samples, annotated MGH30L).
所以作者过滤的比较严格,可以直接下载其分析好的表达矩阵,也可以下载原始测序数据自己走一波转录组流程。
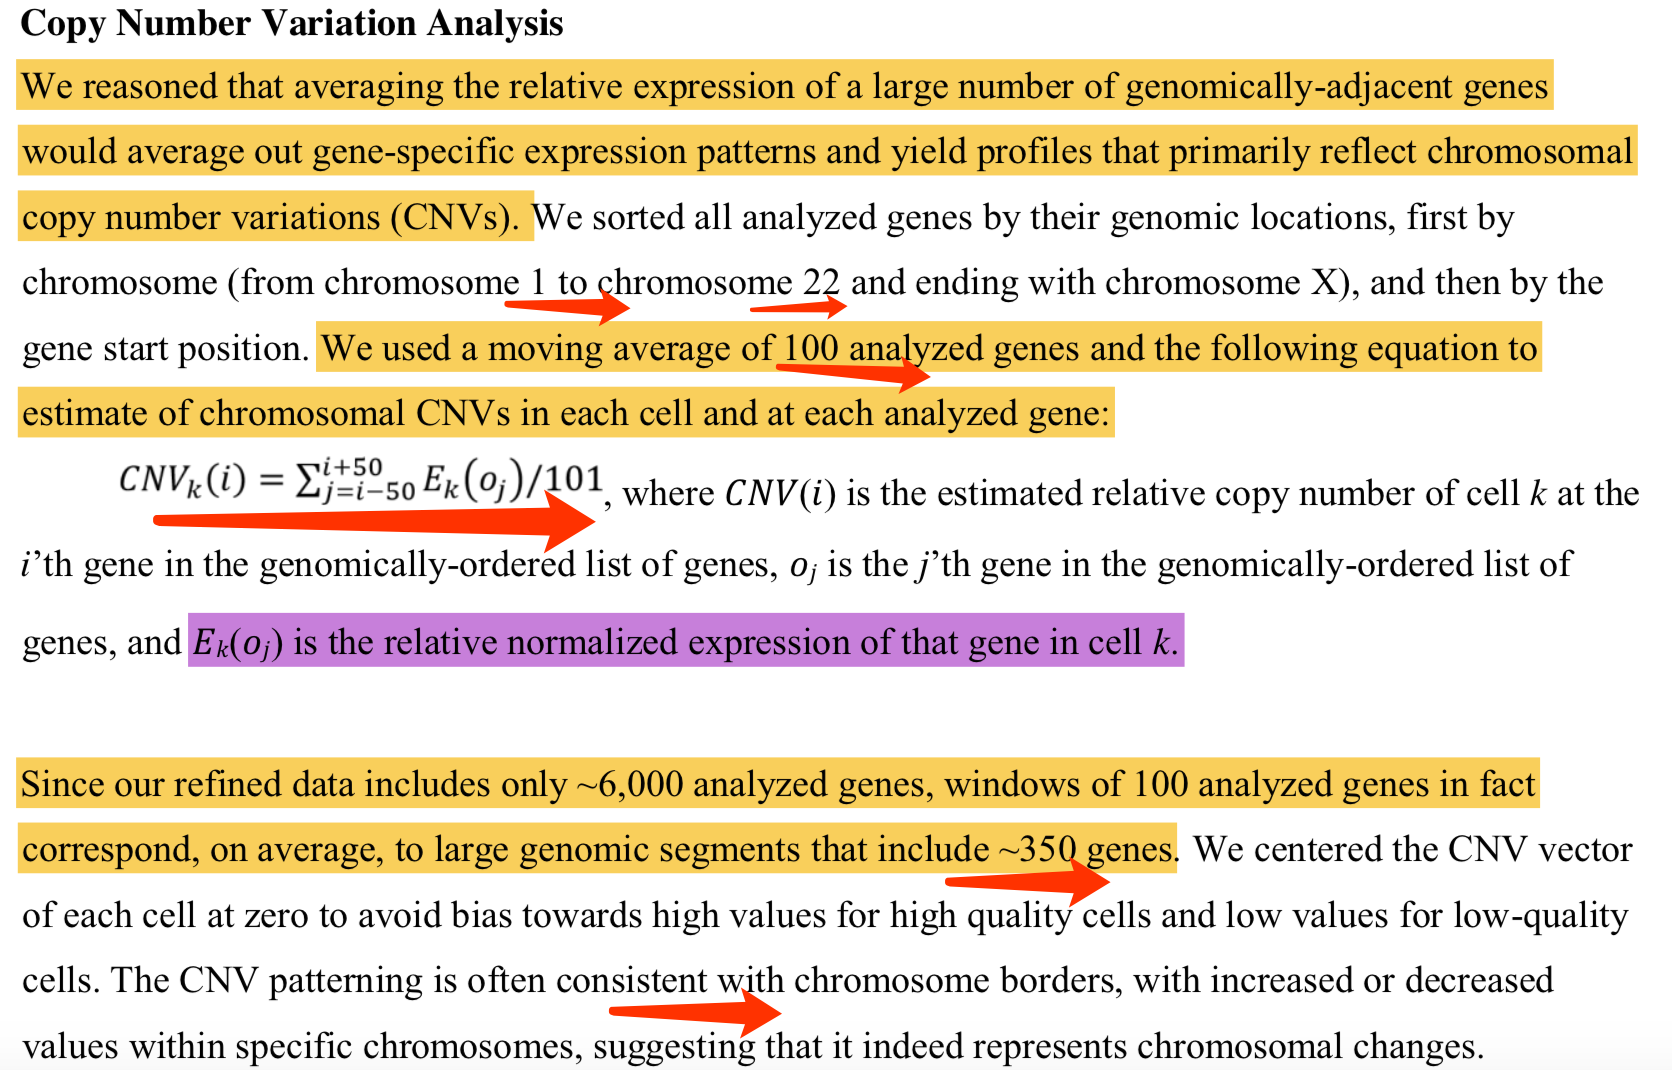
第一次提出的公式如下:
2016年关于melanoma的science文章
然后是2016年关于melanoma的science文章:PMID: 27124452 也应用了单细胞转录组数据分析CNV,该文章的数据公布在 GSE72056 这次使用的Smart-seq2建库技术,共计 4645 个细胞,仅仅是表达矩阵就由71Mb,但是原始的测试数据在 dbGaP 数据库,需要申请才能下载。
| Supplementary file | Size | Download | File type/resource |
|---|---|---|---|
| GSE72056_melanoma_single_cell_revised_v2.txt.gz | 71.6 Mb | (ftp)(http) | TXT |
we applied single-cell RNA sequencing (RNA-seq) to 4645 single cells isolated from 19 patients, profiling malignant, immune, stromal, and endothelial cells.
值得注意的是作者还做了bulk的转录组测序,针对6个处理 RAF or RAF+MEK inhibitors 前后供12个数据,公布在 GSE77940
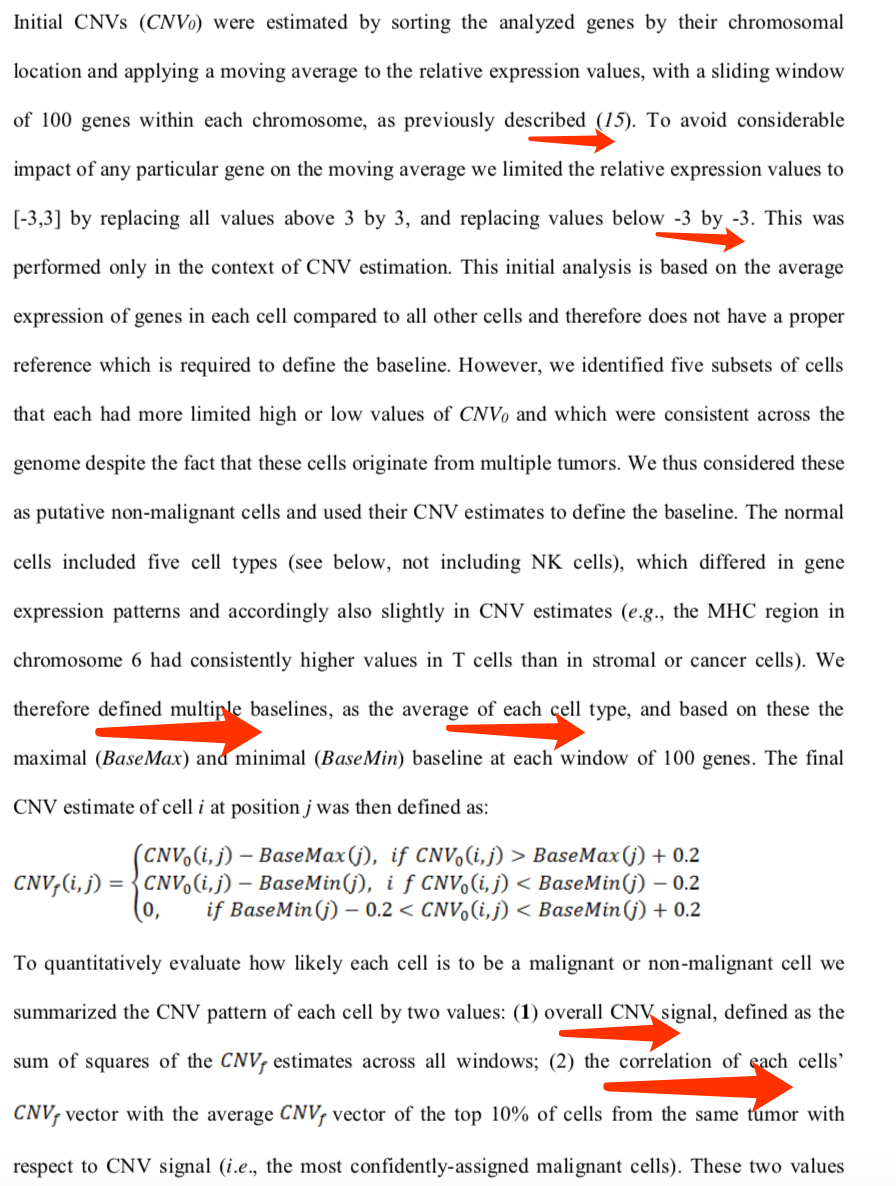
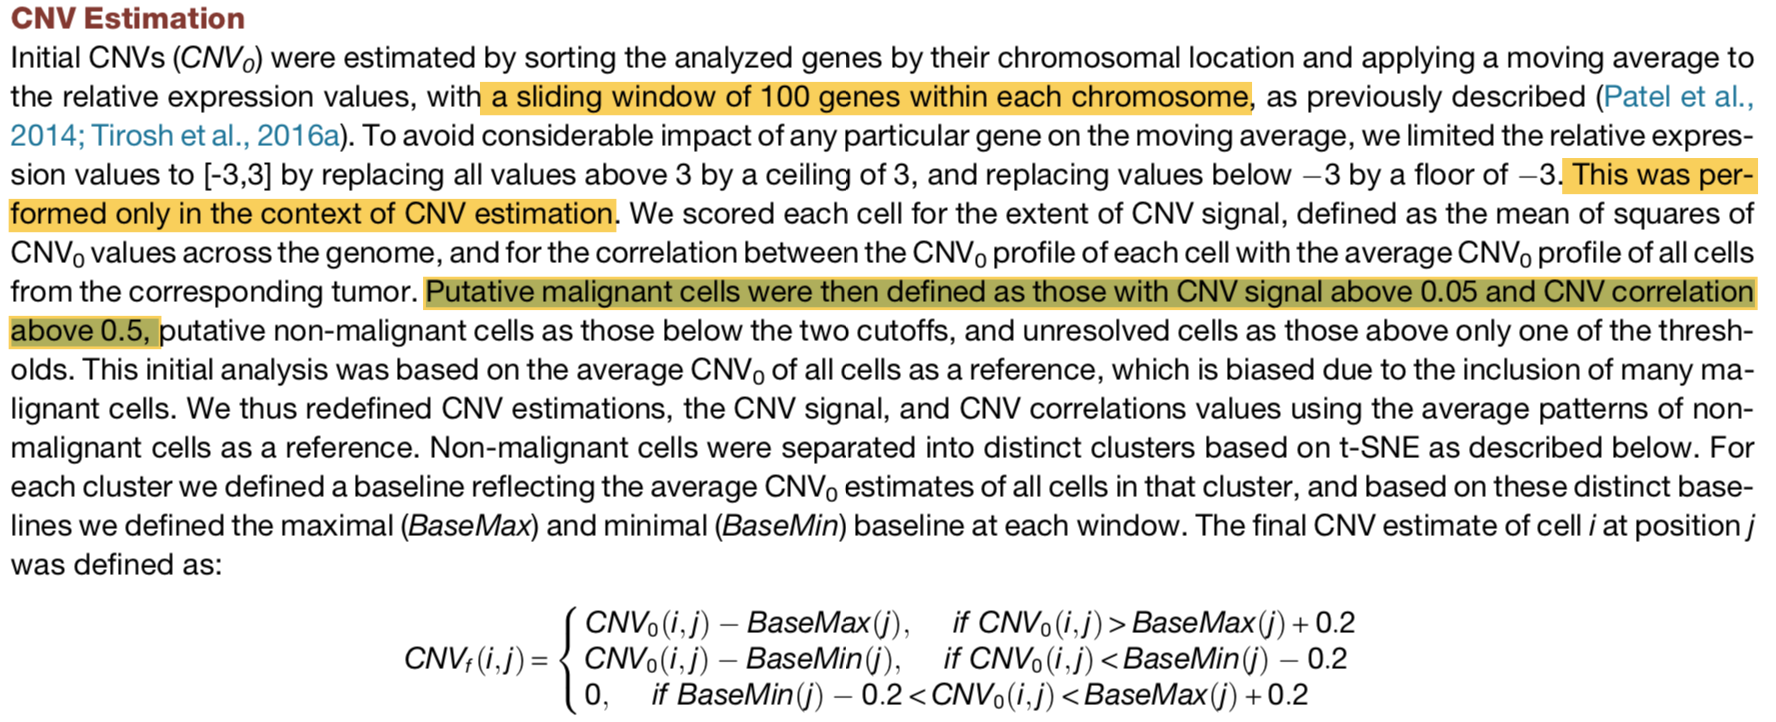
这个时候的计算公式稍微有点变化了,如下:
2016年CELL杂志发表的关于头颈癌
接着是2016年CELL杂志发表的关于头颈癌的文章:Single-Cell Transcriptomic Analysis of Primary and Metastatic Tumor Ecosystems in Head and Neck Cancer 测序如下;
We profiled transcriptomes of ∼6,000 single cells from 18 head and neck squamous cell carcinoma (HNSCC) patients, including five matched pairs of primary tumors and lymph node metastases.
同时也对这些病人测了whole-exome sequencing (WES) and targeted genotyping (SNaPshot) data,但是这些数据公布在 phs001474.v1.p1 ,不是很方便下载。
单细胞转录组建库用的Smart-seq2方法,所有的数据公布在 GSE103322 , 仅仅是表达矩阵都有近100Mb了。
GSE103322_HNSCC_all_data.txt.gz | 86.0 Mb |
用CCLE数据做验证
2014年关于GBM的science文章;PMID: 24925914 ,文章提到:
We downloaded the CCLE gene-centric RMA-normalized Affymetrix data (http://www.broadinstitute.org/ccle/), and centered the expression of each gene across all cell lines at zero.
需要简单注册后才能下载:https://portals.broadinstitute.org/ccle/users/sign_in
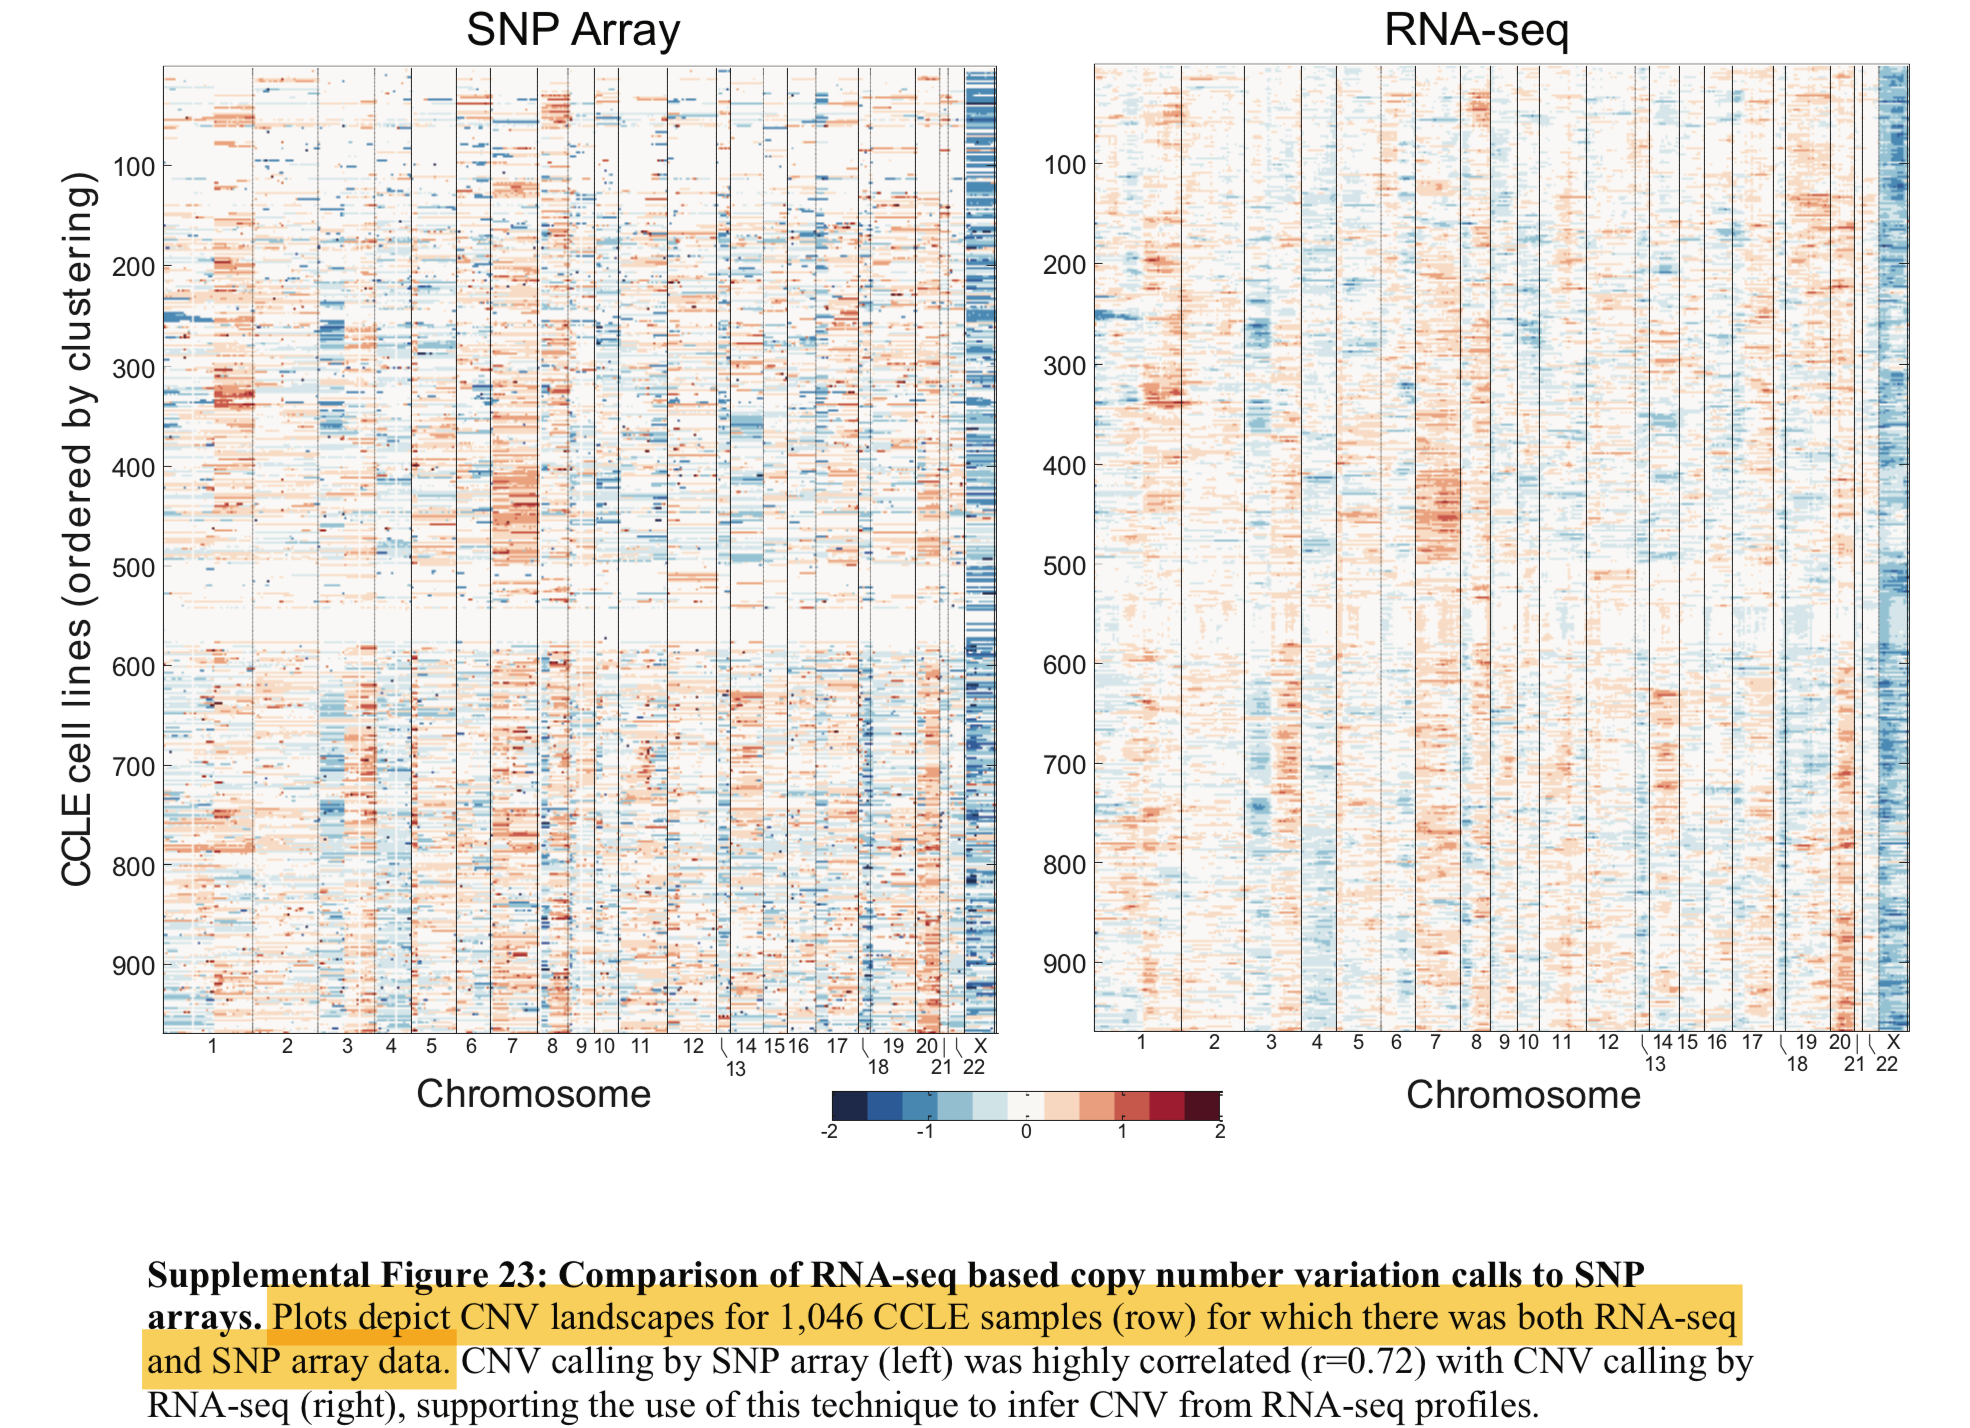
理论上要得到下面的图:
还有GTEx数据库的验证
To compare these patterns to an external reference of normal cells we downloaded RNA-Seq data from the GTEX portal (http://www.gtexportal.org/; gene read counts file from Jan. 2013), and estimated CNV values as above: we normalized the read counts into log2(TPM+1), averaged all brain samples, restricted the data to the ~6,000 analyzed genes, subtracted for each gene the average normalized expression from the GBM single-cell data (this step is comparable to the centering of the single cell data) and then used a moving average of 100 genes over the genomically-ordered list of genes to define CNV-cont.
总结
上述文章及数据都是有表达矩阵可以下载,所以仅仅是根据这些文章的补充材料公布的公式即可重复整个流程啦。