有很多读者来信,CHIP-seq数据比对后的bam文件如果根据基因组的所有基因来画热图,profile图呢?
这里隆重推荐deeptools这个软件:
第一个功能,把bam文件转换为bw格式文件:
bamCoverage -b tmp.sorted.bam -o tmp.bw
里面有一个参数非常重要,就是--extendReads 在 macs软件里面也有,macs2 pileup --extsize 200 ,就算是你的reads长度可能不一致,是否需要把它们补齐成一个统一的长度,因为我们只要是测到了reads,就代表那里是有signal的,只是因为我们的测序仪限制,测到的长度不够,或者质量不好,我们QC的时候,把前后碱基给trim掉了。还可以安装基因组的有效大小来对测序深度进行normlization。
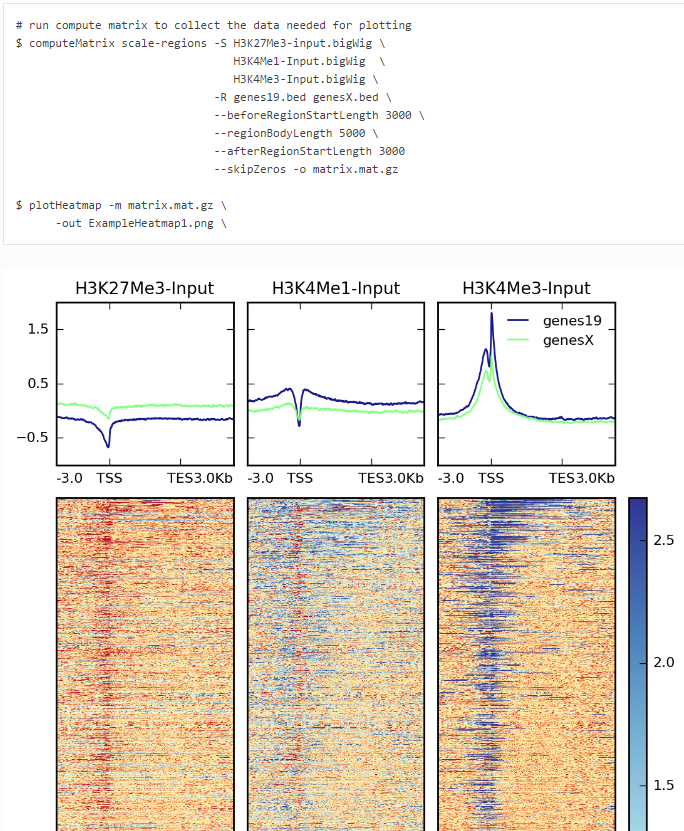
需要自行下载合适的基因坐标记录文件,BED格式的。把上面两个命令结合起来即可,代码和图形实例如下:

第3个功能,画profile的图!
use computeMatrix for all of the signal files (bigWig format) at once
use plotProfile on the resulting file
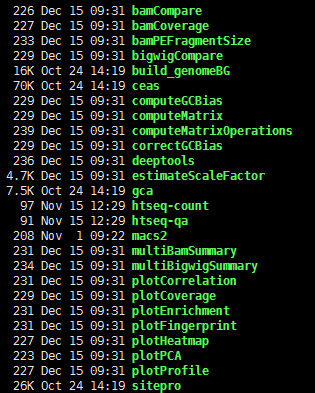
还有很多小功能,欢迎大家去探索,这个软件是python软件,安装非常简单:
## Download and install deepTools## https://github.com/fidelram/deepTools## http://deeptools.readthedocs.io/en/latest/content/example_usage.htmlpip install pyBigWig --usercd ~/biosoftmkdir deepTools && cd deepToolsgit clone https://github.com/fidelram/deepTools ## 130M,cd deepToolspython setup.py install --user## 17 tools in ~/.local/bin/~/.local/bin/deeptools
安装之后,很多小工具都放到了~/.local/bin/目录:

如果你有大批量的bam文件,需要批量做,用下面的脚本啦:
ls ../bamFiles/*bam |while read iddofile=$(basename $id )sample=${file%%.*}echo $samplebamCoverage -b $id -o $sample.bwcomputeMatrix reference-point --referencePoint TSS -b 10000 -a 10000 -R ~/annotation/CHIPseq/mm10/ucsc.refseq.bed -S $sample.bw --skipZeros -o matrix1_${sample}_TSS.gz --outFileSortedRegions regions1_${sample}_genes.bedplotHeatmap -m matrix1_${sample}_TSS.gz -out ${sample}.pngdone