经过热心的小伙伴的提醒,我才知道我以前写的R语言画网络图三部曲竟然漏掉了最基础的一个包,就是igraph,不了解这个,后面的两个也是无源之水。
R语言画网络图三部曲之networkD3
R语言画网络图三部曲之sna
其实包括了3个包:igraph/RBGL/Rgraphviz
用到了一个测试数据,是构建好的PPI网络对象:We will first analyse a curated data set of protein-protein interactions in the yeast Saccharomyces cerevisiae extracted from published papers. This data set comes from with an R package called “yeastExpData”, which calls the data set “litG”. This data was first described in a paper by Ge et al (2001) in Nature Genetics (http://www.nature.com/ng/journal/v29/n4/full/ng776.html).
重点是graphNEL graph对象如何构造以及如何用函数来处理它!
构造方式,请记住,构造网络对象是重点,就是graph.data.frame+as_graphnel即可,一系列以网络对象为基础的包都需要这个步骤,学会了,也就没有问题了!
读取PPI数据到data.frame里面,比如my_edges

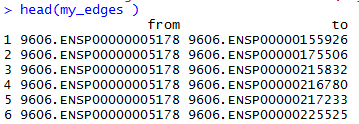
tmp <- graph.data.frame(my_edges)
tmp;summary(tmp)
plot(tmp, layout=layout.kamada.kawai)
subnet <- as_graphnel(tmp)
这个时候得到的subnet就是一个网络对象啦!
> subnet
A graphNEL graph with directed edges
Number of Nodes = 818
Number of Edges = 12249
有了这个网络对象,就可以用BioNet来处理找maximal-scoring subgraph
对于网络对象,其它处理的函数有
mynodes <- nodes(litG) 得到网络里面的所有节点信息
adj(litG, "YBR009C") 得到网络里面的YBR009C这个node节点的所有edges
mydegrees <- graph::degree(litG) 算出网络里面的每个node的degree
table(mydegrees);mean(mydegrees);hist(mydegrees, col="red") 看看degree的分布情况。
对比较大的网络来说,并非里面的node都是连通的,可以用RBGL包来看看哪些nodes被隔离开了。
library("RBGL") myconnectedcomponents <- connectedComp(litG)
返回的myconnectedcomponents这个list的每个元素都是一个被隔离开的网络图,可以去找最大连通图,也可以对这个list找到特定的某个node参与的连通图。
component3 <- myconnectedcomponents[[3]]
mysubgraph <- subGraph(component3, litG) 取指定的连通图,生成graphNEL对象,其实就是根据nodes来取子网络图。
下面代码可以把网络图展现出来:
library("Rgraphviz") mysubgraph <- subGraph(component3, litG) mygraphplot <- layoutGraph(mysubgraph, layoutType="neato") renderGraph(mygraphplot)
对网络图还可以找communities,这个又是一个网络图研究术语了: http://en.wikipedia.org/wiki/Community_structure
还可以进行聚类,就是cluster,还有很多,我就不一一介绍了。
上面的连通图也是一个网络研究术语:http://en.wikipedia.org/wiki/Connected_component_(graph_theory)