学习使用genefu这个包,首先需要安装它!
source("http://bioconductor.org/biocLite.R")
options(BioC_mirror="http://mirrors.ustc.edu.cn/bioc/")
biocLite("genefu")
教程略微有点复杂:https://rdrr.io/bioc/genefu/f/inst/doc/genefu.pdf
这个包自带了5个乳腺癌芯片数据集,需要了解他们,可以看我在生信技能树发的教程:https://vip.biotrainee.com/d/689-5
包里面自带的数据集也非常多,可以在https://rdrr.io/bioc/genefu/man/ 查看列表,比较重要的如下:
| gene70 | Function to compute the 70 genes prognosis profile (GENE70)… |
|---|---|
| gene76 | Function to compute the Relapse Score as published by Wang et… |
| mod1 | Gene modules published in Desmedt et al. 2008 |
|---|---|
| mod2 | Gene modules published in Wirapati et al. 2008 |
| scmgene.robust | Subtype Clustering Model using only ESR1, ERBB2 and AURKA… |
|---|---|
| scmod1.robust | Subtype Clustering Model using ESR1, ERBB2 and AURKA modules… |
| scmod2.robust | Subtype Clustering Model using ESR1, ERBB2 and AURKA modules… |
| sig.endoPredict | Signature used to compute the endoPredict signature as… |
|---|---|
| sig.gene70 | Signature used to compute the 70 genes prognosis profile… |
| sig.gene76 | Signature used to compute the Relapse Score (GENE76) as… |
| sig.genius | Gene Expression progNostic Index Using Subtypes (GENIUS) as… |
| sig.ggi | Gene expression Grade Index (GGI) as published in Sotiriou et… |
| sig.oncotypedx | Signature used to compute the OncotypeDX signature as… |
| pam50 | PAM50 classifier for identification of breast cancer… |
|---|---|
| pik3cags | Function to compute the PIK3CA gene signature (PIK3CA-GS) |
上面列出的这些数据集都是可以打开看的:
library(genefu)
data(pam50)
data(pam50.scale)
data(pam50.robust)
data(scmod2.robust)
pam50
str(scmod2.robust, max.level=1)
最重要的功能就是根据已知基因集来对乳腺癌进行分子分型
所有的分型都是用molecular.subtyping函数,预背了很多可以进行乳腺癌进行分子分型的基因集,比如大名鼎鼎的PAM50,下面是演示:
rm(list = ls())
library(breastCancerMAINZ)
library(breastCancerTRANSBIG)
library(breastCancerUPP)
library(breastCancerUNT)
library(breastCancerNKI)
data(transbig)
dd=transbig
cinfo <- colnames(pData(dd))
cinfo
ddata <- t(exprs(dd))
dannot <- featureData(dd)@data
ddemo <- phenoData(dd)@data

library(genefu)
SubtypePredictions<-molecular.subtyping(sbt.model = "scmod2",data = ddata,
 annot = dannot,do.mapping = TRUE)
table(SubtypePredictions$subtype)
ddemo$SCMOD2<-SubtypePredictions$subtype

PAM50Preds<-molecular.subtyping(sbt.model = "pam50",data=ddata,
 annot=dannot,do.mapping=TRUE)

table(PAM50Preds$subtype)
ddemo$PAM50<-PAM50Preds$subtype
分类结果如下:
> table(SubtypePredictions$subtype)

ER+/HER2- High Prolif ER+/HER2- Low Prolif ER-/HER2- HER2+
 50 77 49 22

> table(PAM50Preds$subtype)

Basal Her2 LumB LumA Normal
 45 26 45 78 4
需要懂这个数据集才能理解,还需要有一点乳腺癌研究背景知识。
成功分类后的信息,就可以用来做生存分析
# http://www.inside-r.org/r-doc/survival/survfit.coxph
library(survival)
data.for.survival.SCMOD2 <- ddemo[,c("e.os", "t.os", "SCMOD2","age")]
data.for.survival.PAM50 <- ddemo[,c("e.os", "t.os", "PAM50","age")]
# Remove patients with missing survival information
data.for.survival.SCMOD2 <- data.for.survival.SCMOD2[complete.cases(data.for.survival.SCMOD2),]
data.for.survival.PAM50 <- data.for.survival.PAM50[complete.cases(data.for.survival.PAM50),]
days.per.month <- 30.4368
days.per.year <- 365.242
data.for.survival.PAM50$months_to_death <- data.for.survival.PAM50$t.os / days.per.month
data.for.survival.PAM50$vital_status <- data.for.survival.PAM50$e.os == "1"
surv.obj.PAM50 <- survfit(Surv(data.for.survival.PAM50$months_to_death,
data.for.survival.PAM50$vital_status) ~ data.for.survival.PAM50$PAM50)
data.for.survival.SCMOD2$months_to_death <- data.for.survival.SCMOD2$t.os / days.per.month
data.for.survival.SCMOD2$vital_status <- data.for.survival.SCMOD2$e.os == "1"
surv.obj.SCMOD2 <- survfit(Surv(
data.for.survival.SCMOD2$months_to_death,
data.for.survival.SCMOD2$vital_status) ~ data.for.survival.SCMOD2$SCMOD2)
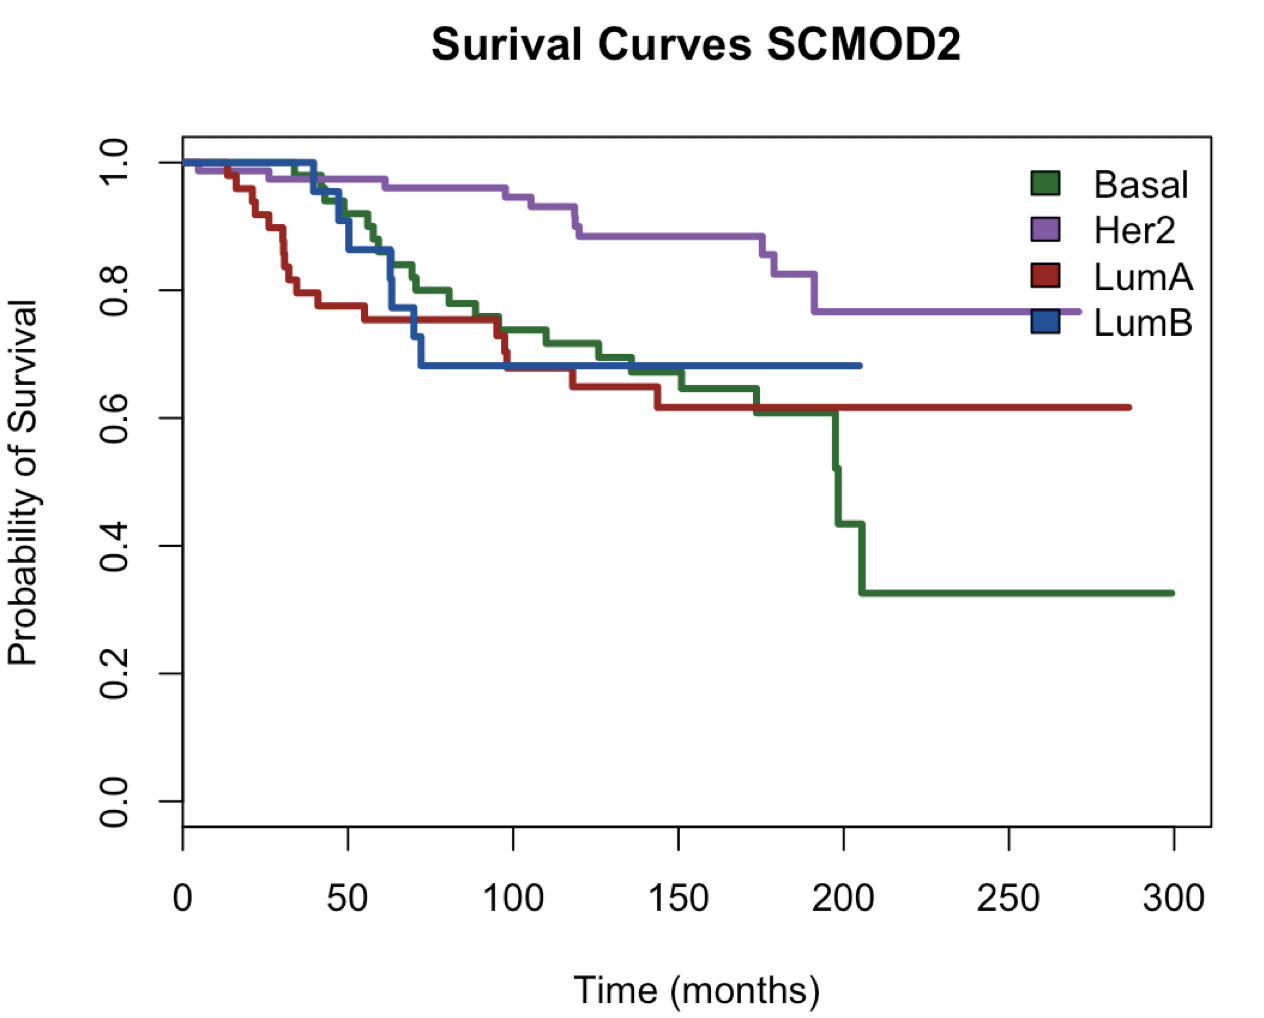
message("KAPLAN-MEIR CURVE - USING PAM50")
plot(main = "Surival Curves SCMOD2", surv.obj.SCMOD2,
col =c("#006d2c", "#8856a7","#a50f15", "#08519c"),lty = 1,lwd = 3,
xlab = "Time (months)",ylab = "Probability of Survival")
legend("topright",fill = c("#006d2c", "#8856a7","#a50f15", "#08519c"),
legend = c("Basal","Her2","LumA","LumB"),bty = "n")
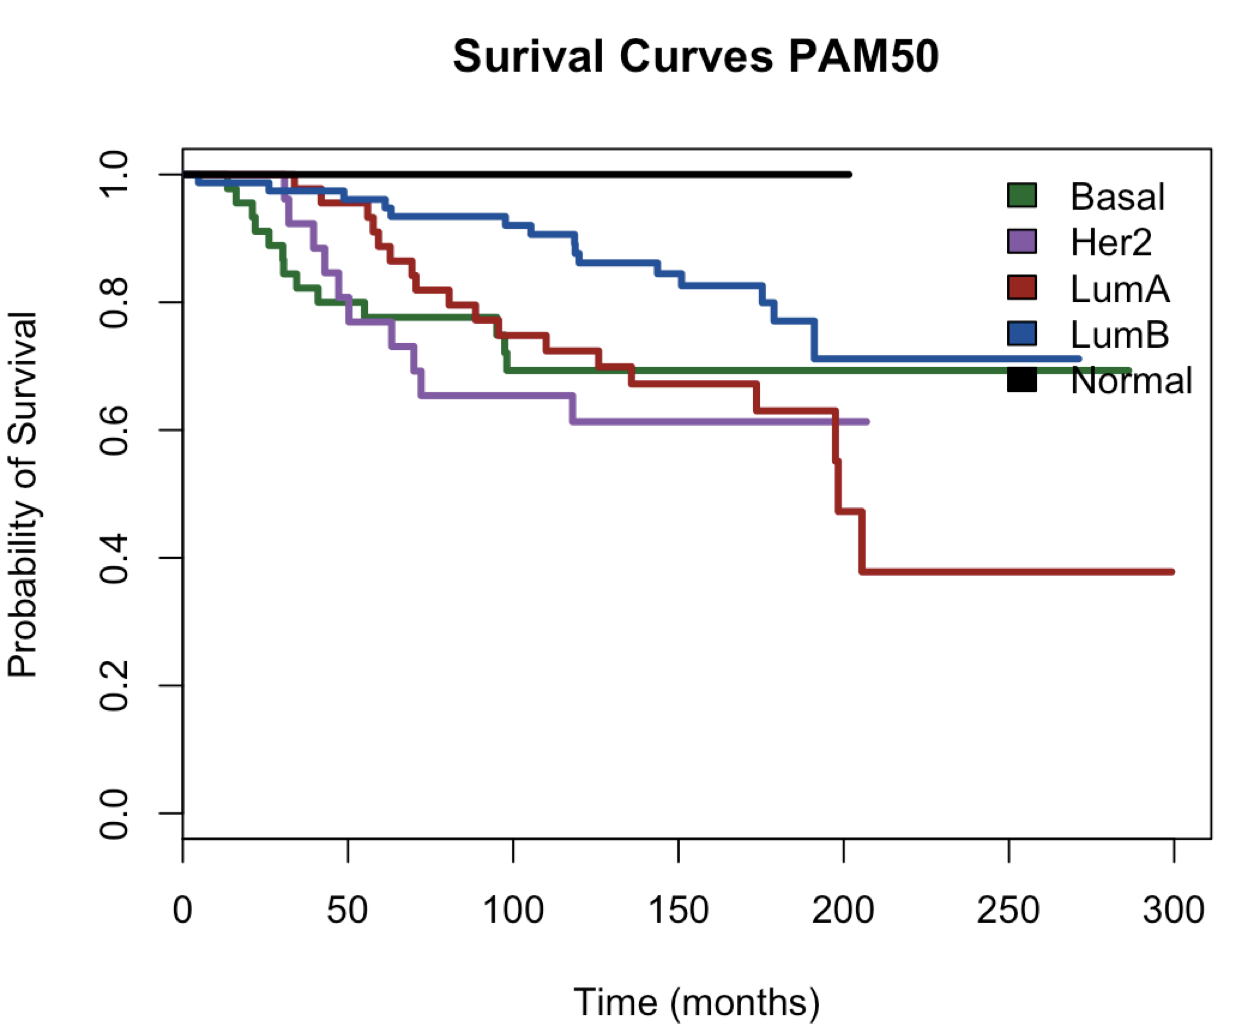
plot(main = "Surival Curves PAM50", surv.obj.PAM50,
col =c("#006d2c", "#8856a7","#a50f15", "#08519c", "#000000"),lty = 1,lwd = 3,
xlab = "Time (months)",ylab = "Probability of Survival")
legend("topright",
fill = c("#006d2c", "#8856a7","#a50f15", "#08519c", "#000000"),
legend = c("Basal","Her2","LumA","LumB","Normal"),bty = "n")
也可以把这两个分类画在一张图上,或者添加统计学显著指标,你们自己尝试一下哦,我在生信技能树论坛也多次提到过,就不再赘述咯。
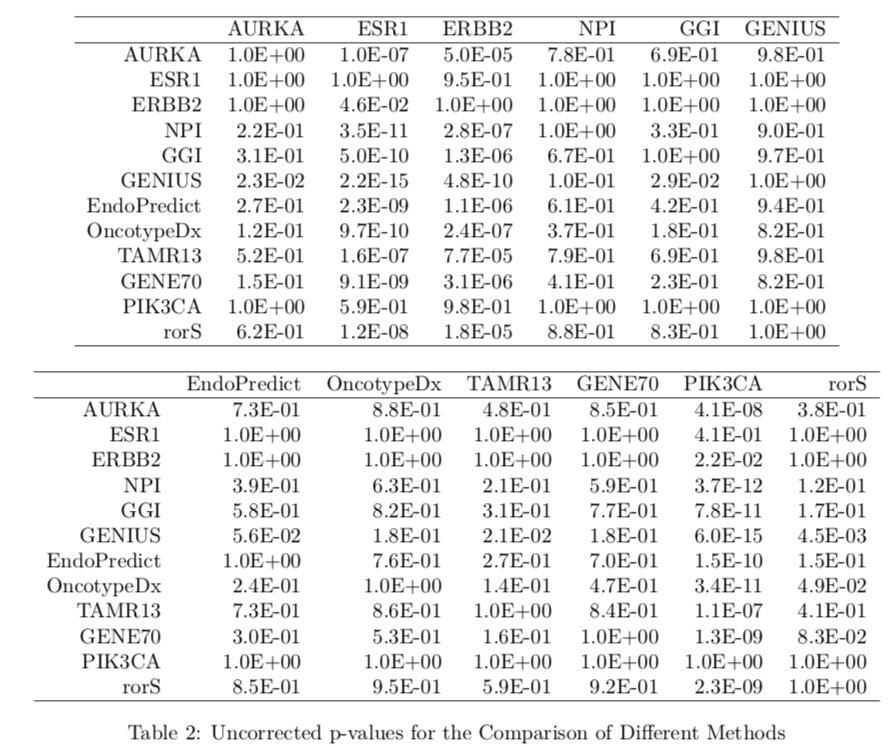
提示一下,可以使用 Cross-validated Partial Likelihood (cvpl) 模型来检验两个分类方法的预后判断情况。
更多分类标准
前面我们提到过,这个包最大的优点就是内置了一系列分类指标,如下;
Subtype Clustering Model using just the AURKA gene: scmgene.robust()
Subtype Clustering Model using just the ESR1 gene: scmgene.robust() Subtype Clustering Model using just the ERBB2 gene: scmgene.robust()
NPI: npi()
GGI: ggi()
GENIUS: genius()
EndoPredict: endoPredict()
OncotypeDx: oncotypedx()
TamR: tamr()
GENE70: gene70()
PIK3CA: pik3cags()
rorS: rorS()
基本上是,可以想怎么分类,就怎么分类了。