Lecture4_my-script-with-R_hclust
Jimmy(jmzeng1314@outlook.com)
Keywords: hclust
x=runif(10)
y=runif(10)
S=cbind(x,y)
#得到2维的数组
rownames(S)=paste("Name",1:10,"")
#赋予名称,便于识别分类
out.dist=dist(S,method="euclidean") #数值变距离
plclust(out.hclust)
rect.hclust(out.hclust,k=3)
out.id=cutree(out.hclust,k=3)
a=read.table("GSE62254_series_matrix.txt.gz",comment.char
= "!",stringsAsFactors=F,header=T)
rownames(a)=a[,1]
a=a[,-1]
#> dim(a)
#[1] 54675 300
d=a
mads=apply(d,1,mad)
d=d[rev(order(mads))[1:5000],]
d = sweep(d,1, apply(d,1,median,na.rm=T))
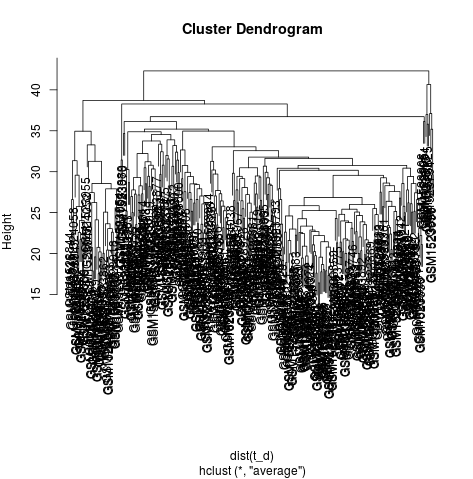
t_d=t(d)
hc <- hclust(dist(t_d), "ave")
png("hclust.png")
plot(hc)
dev.off()
useful links : http://www.bio-info-trainee.com/?p=903